Creating custom client dashboards
You can create custom Client Dashboards, similar to those in the console. Dashboards are HTML files with embedded Relevance clauses that can analyze the local computer and print out the current results.
Clients with a dashboard have an extra tab to display the resulting report. Note that dashboard global variables can be accessed from custom dashboards owned by other operators regardless of permissions.
To create a Client Dashboard, you must create a new folder named __UISupport (note the leading underlines) in the __BESData folder. This is a subfolder of the client folder, so the final pathname looks like:
Program Files/BigFix Enterprise/BES Client/__BESData/__UISupport
Place the Dashboard file (named _dashboard.html) and any accompanying graphics
files into this folder. The next time the client starts, it incorporates these files into its
interface, adding to the Dashboard tab. When you click this tab, the
Dashboard calculates the latest values of each Relevance clause and displays them.
Any further changes to your custom dashboard must be performed in the __UISupport folder and promoted by restarting the client computer.
The Relevance statements are embedded in the HTML inside special tags with the form:
<?relevance statement ?>For example, to find and print the time, use the following:
<?relevance now ?>When the client displays the page containing this statement, the client evaluates the Relevance clause “now?" and substitutes the value for the tag. The following sample HTML prints out the word “Date:�? and then the current date and time:
<html>
 <body>
 Date: <?relevance now ?>
 </body>
</html>
To refresh the Relevance evaluation, add this line to the file:
<html>
 <body>
 Date: <?relevance now ?>
 <A href="cid:load?page=_dashboard.html"> Refresh </A>
 </body>
</html>
This link, labeled Refresh, causes the page to reload. When it does, it reevaluates the relevance clauses. It is easy to see how you would add other Relevance expressions to this page.
For example, to print out the operating system and the computer name, add these two lines:
<html>
 <body>
 Date: <?relevance now ?>
 Operating System: <?relevance name of operating system ?>
 Computer Name: <?relevance computer name ?>
 <A href="cid:load?page=_dashboard.html"> Refresh </A>
 </body>
</html>
You can use style sheets to format the output. You can use the default style-sheet, offer.css for some preset formatting. Here is an example of a Dashboard with a title, a header, a refresh link, and a section of retrieved property values:
<html>
      <head>
         <link type="text/css" rel="stylesheet" href="offer.css"></link>
         <title>BigFix Dashboard Example</title>
      </head>
      <body>

       <div class="header">
         <div class="headerTitle">
             <font size="6"><?relevance computer name ?></font>
         </div>
         <div class="headerCategory">
             <font size="1">(Last updated: <?relevance now ?>)</font><BR>
           <div><font size="1">
              <a href="cid:load?page=_dashboard.html">Refresh</a></font>
           </div>
         </div>
       </div>

          <div class="section">
                <div class="sectionHeader">Computer Information</div>
                <div class="subsection">
                    <table>
                        <tr>
                             <td valign="top">OS: </td>
                             <td><?relevance operating system ?></td>
                        </tr>
                        <tr>
                           <td valign="top">RAM: </td>
                           <td><?relevance (size of ram)/1048576 ?> MB</td>
                        </tr>
                        <tr>
                           <td valign="top">DNS Name: </td>
                           <td><?relevance dns name ?></td>
                        </tr>
                    </table>
                </div>
          </div>
    </body>
</html>
For the offer.css to work correctly, the following graphics files must be copied to the __UISupport directory from the Client directory:
      bodyBg.jpg,
      bodyHeaderBg.jpg
      bullet.gif
      sectionHeaderBG.gif
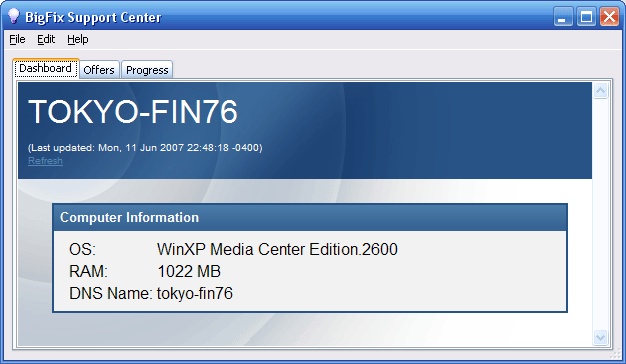
When run from the Client, this dashboard produces the following output:

To learn more about Relevance expressions, see the Relevance Language Reference.