Dashboard
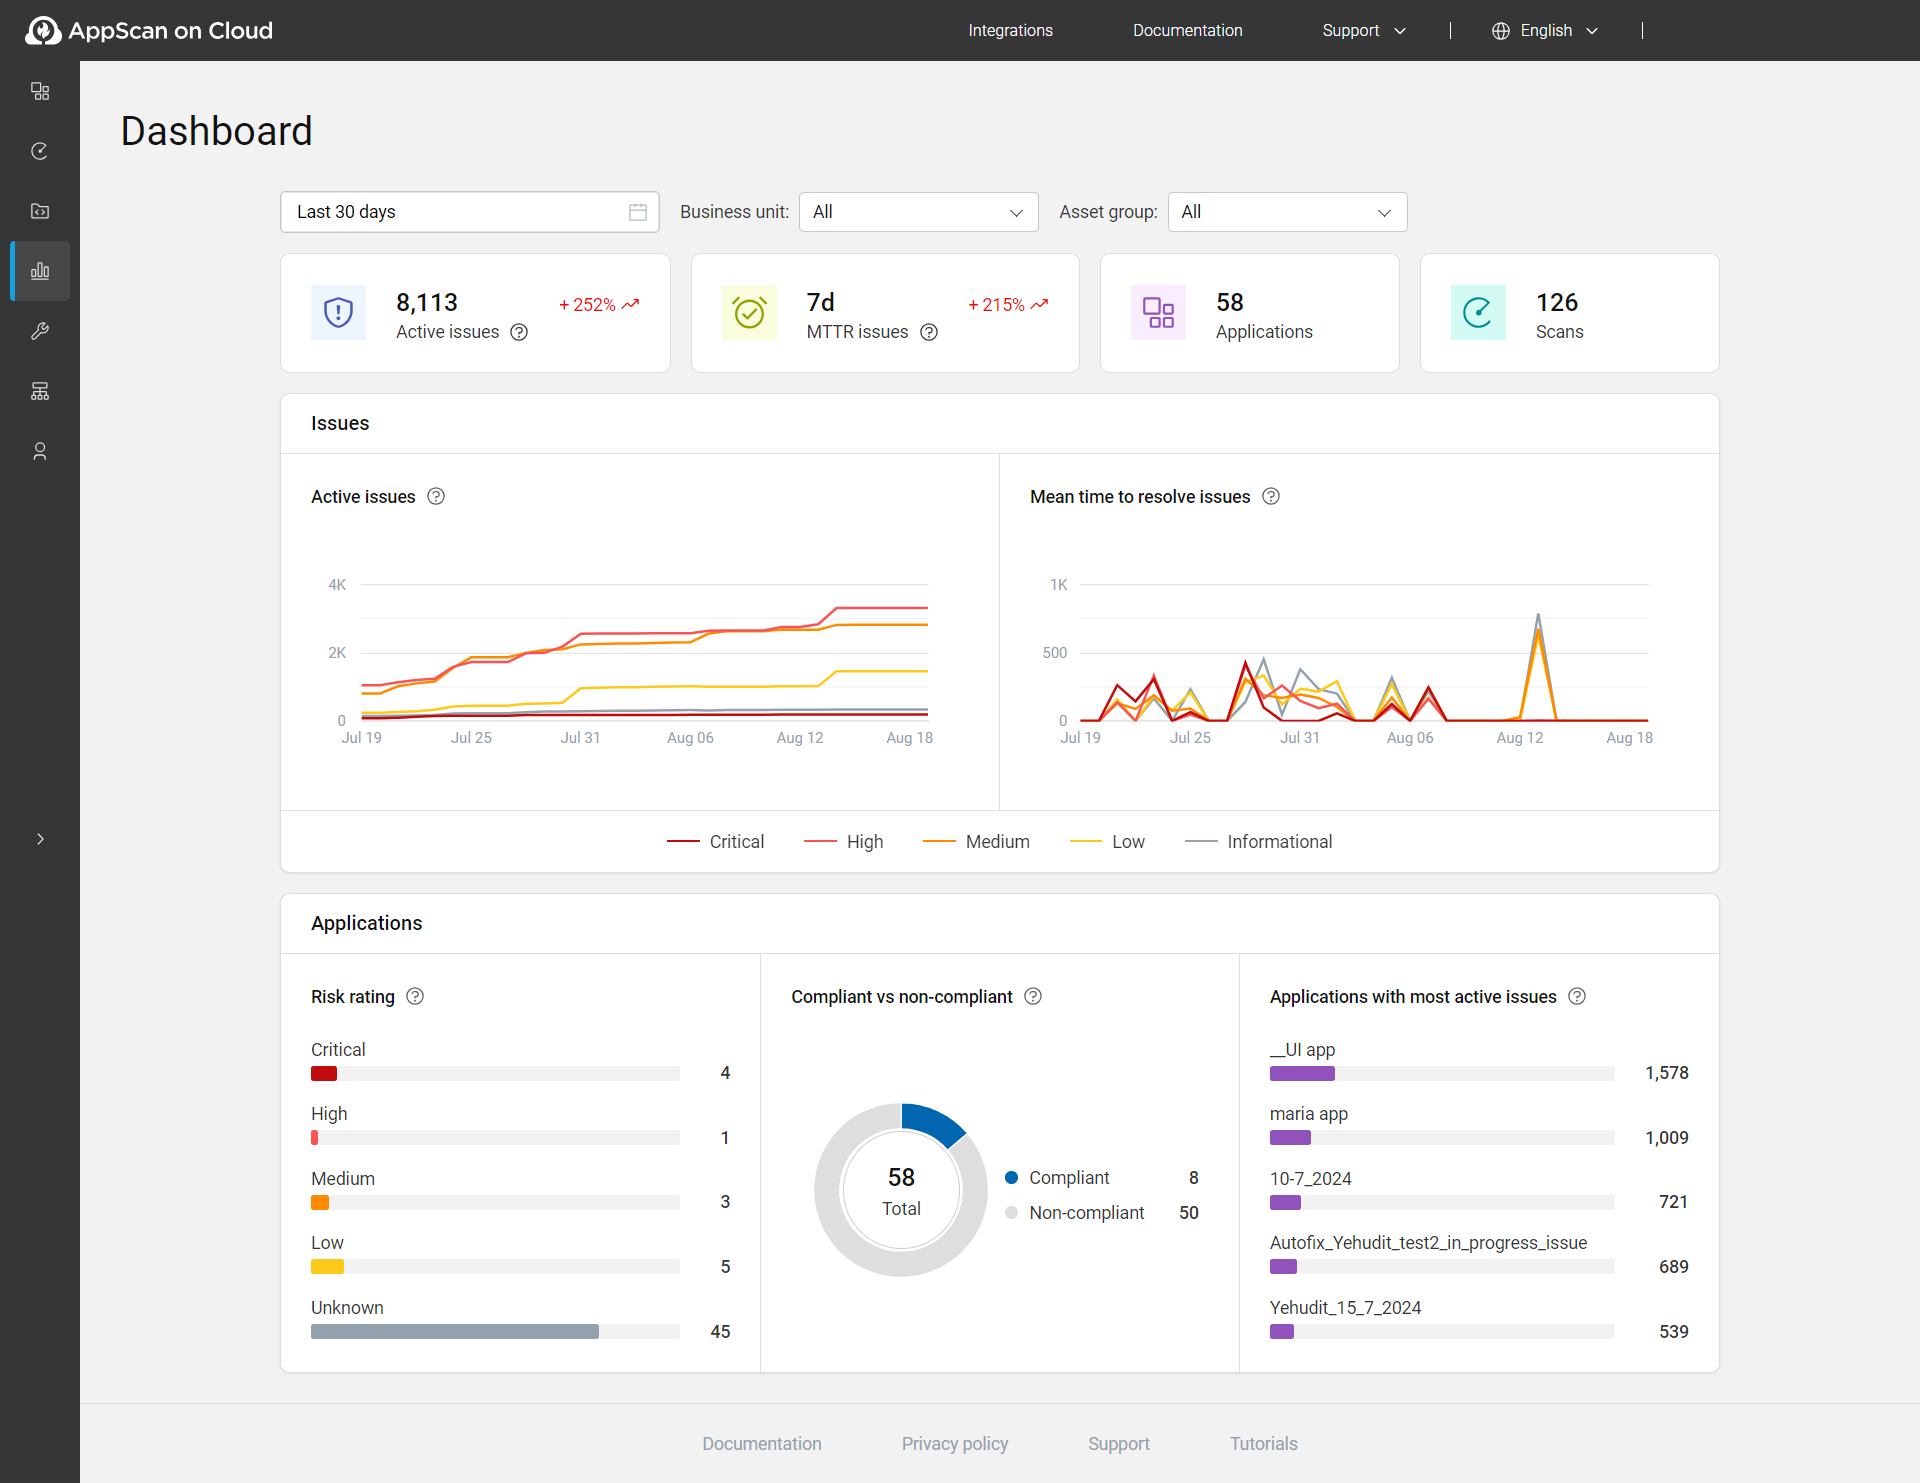
The main dashboard is the fourth item on the main menu bar. It gives you a detailed overview of active issues, MTTR issues, applications, and scans along with graphs and charts that display the overall state of your applications.
The Dashboard displays data for all applications for the last three months by default. To view data for a different time period, you can adjust the dates using the Date filter. Additionally, to filter data by applications, business unit, and/or asset group, apply the Filters located at the top of the page.
Dashboard page options
| Chart/Graph | Description |
|---|---|
| Active issues |
The total count of active issues includes those with statuses Open, In progress, or Reopened. These issues are considered across all applications and dates within the selected range, taking into account any applied filters. Trend: Shows the data at the end of the selected time period compared to the data at the beginning. For example, +252%. |
| MTTR issues |
Mean Time to Resolve (MTTR) issues refers to the average time taken in days to resolve issues within the selected time period, counting only those issues that were marked as fixed or passed. It is displayed as days, with less than a day presented as 0. Calculation of the KPI: All the issues that were closed during the total time interval are taken, the time it took to close them is summed, and this total is divided by the number of issues. Trend: Shows the value for the selected period compared to the preceding period. For example, +215%. |
| Applications | The total count of applications for the selected date range and applied filters. |
| Scans | The number of executions the user ran during the selected date range, including deleted executions, but excluding personal scans. Here, execution means the number of times a scan was run. |
| Issues | |
| Active issues | Shows the line graph of active issues over time by severity for a selected date range and applied filters. |
| Mean time to resolve issues over time | Shows the line graph of mean time to resolve issues over time
by severity in days for a selected date range and applied
filters. Calculation of the MTTR line chart: For each severity, all the issues that were closed during the time interval are taken, the time it took to close them is summed, and this total is divided by the number of issues that were closed. |
| Applications | |
| Risk rating | Shows the proportions and numbers of applications
in the portfolio with each type of risk rating: Critical,
High, Medium, Low, and Unknown.
Click the bar or number of applications to view the applications
for that particular risk rating. The risk rating is calculated based on the business impact of the application, and the severity of issues found in scans. For more details, see Risk rating. |
| Compliant vs non-compliant | Shows the proportions and number of applications that are compliant and non-compliant (issues with status Open, In Progress, or Reopened and are also non-compliant with one or more policies). Click the pie or legend to view the applications that are compliant or non-compliant. |
| Applications with most active issues | Shows the top five applications in your portfolio with the highest number of active issues. The total number of issues is displayed next to each application name. The bar displays the proportion in comparison to the active issues. Click the bar or number of issues to view the single view application page. |
| Scans | |
| Completed | Displays the total number of completed and partial executions. |
| Failed | Displays the total number of failed scans. |
| Scans by technology |
For DAST, SAST, and SCA, the bar shows the total number of executions, deleted scans, and failed scans (it does not include personal scans). For IAST, the bar shows the number of active connected sessions over time. Click the bar to see the Scans and sessions page for a specific technology. |
| Technology | |
| Applications by technology |
Applications are sorted by their technologies like DAST, SAST, IAST, SCA, and their combinations. Applications with no scans don't have a specified technology and are shown as "Applications without scans". Click the tile to view Applications page with the selected technologies. |
| SCA | |
| Top five licenses in applications | Shows the top five licenses used in SCA applications. |