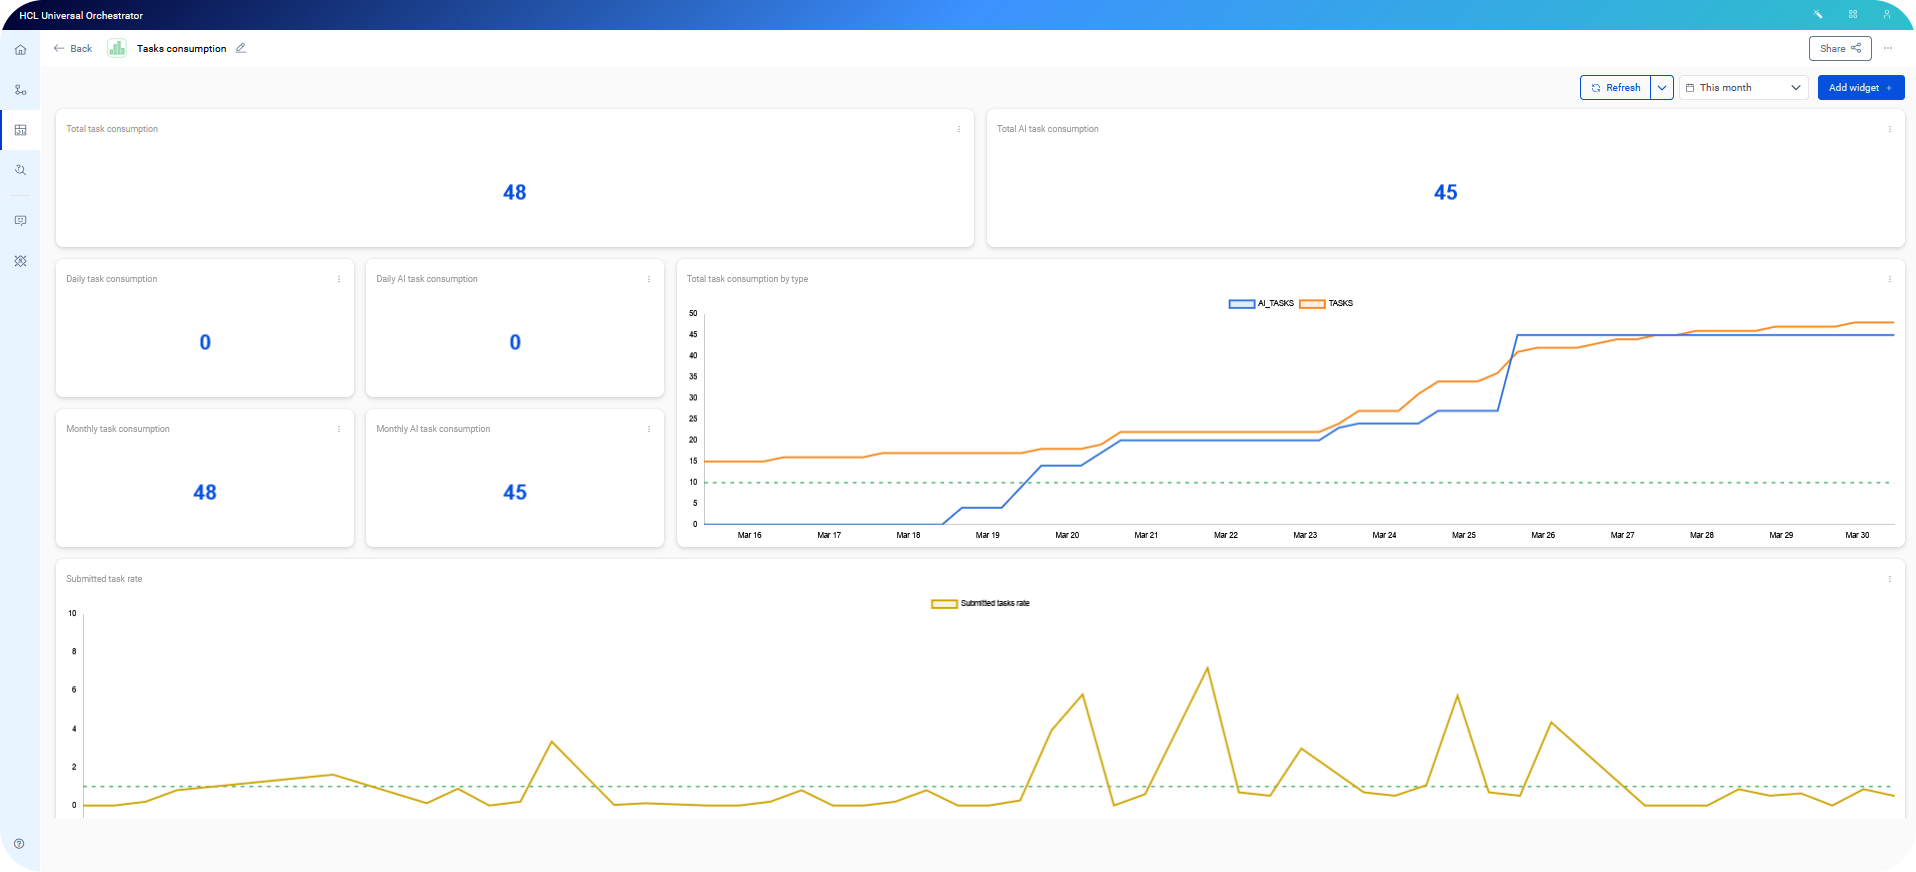
Dashboards: visualize your workload health

The new Dashboards feature provides a comprehensive, graphical view of your scheduling environment health.

This centralized view provides real-time visibility into your workloads, helping you identify bottlenecks and optimize resource utilization at a glance.

Gain immediate insight: By transforming raw data into clear, visual metrics, you can monitor real-time status and historical trends to ensure your automation runs smoothly.
  • Workload health: Track tasks by status and identify processing delays or missed deadlines.
  • Resource capacity: Monitor workstation connectivity and prevent exceeding defined capacity limits.
  • Consumption Tracking: Keep a close eye on operational costs with granular views of daily and monthly task volume, including dedicated tracking for AI agent calls.


Collaboration & portability:
  • Sharing: Grant view-only access to teammates or groups. While the layout is shared, data visibility remains secure: users only see information they are authorized to access.
  • Import/Export: Move your dashboard configurations between environments using JSON exports, or capture snapshots for reporting in PDF and PNG formats.
  • Personal workspace: Organize your views using the new My dashboards, Shared with me, and Trash sections for easy management.
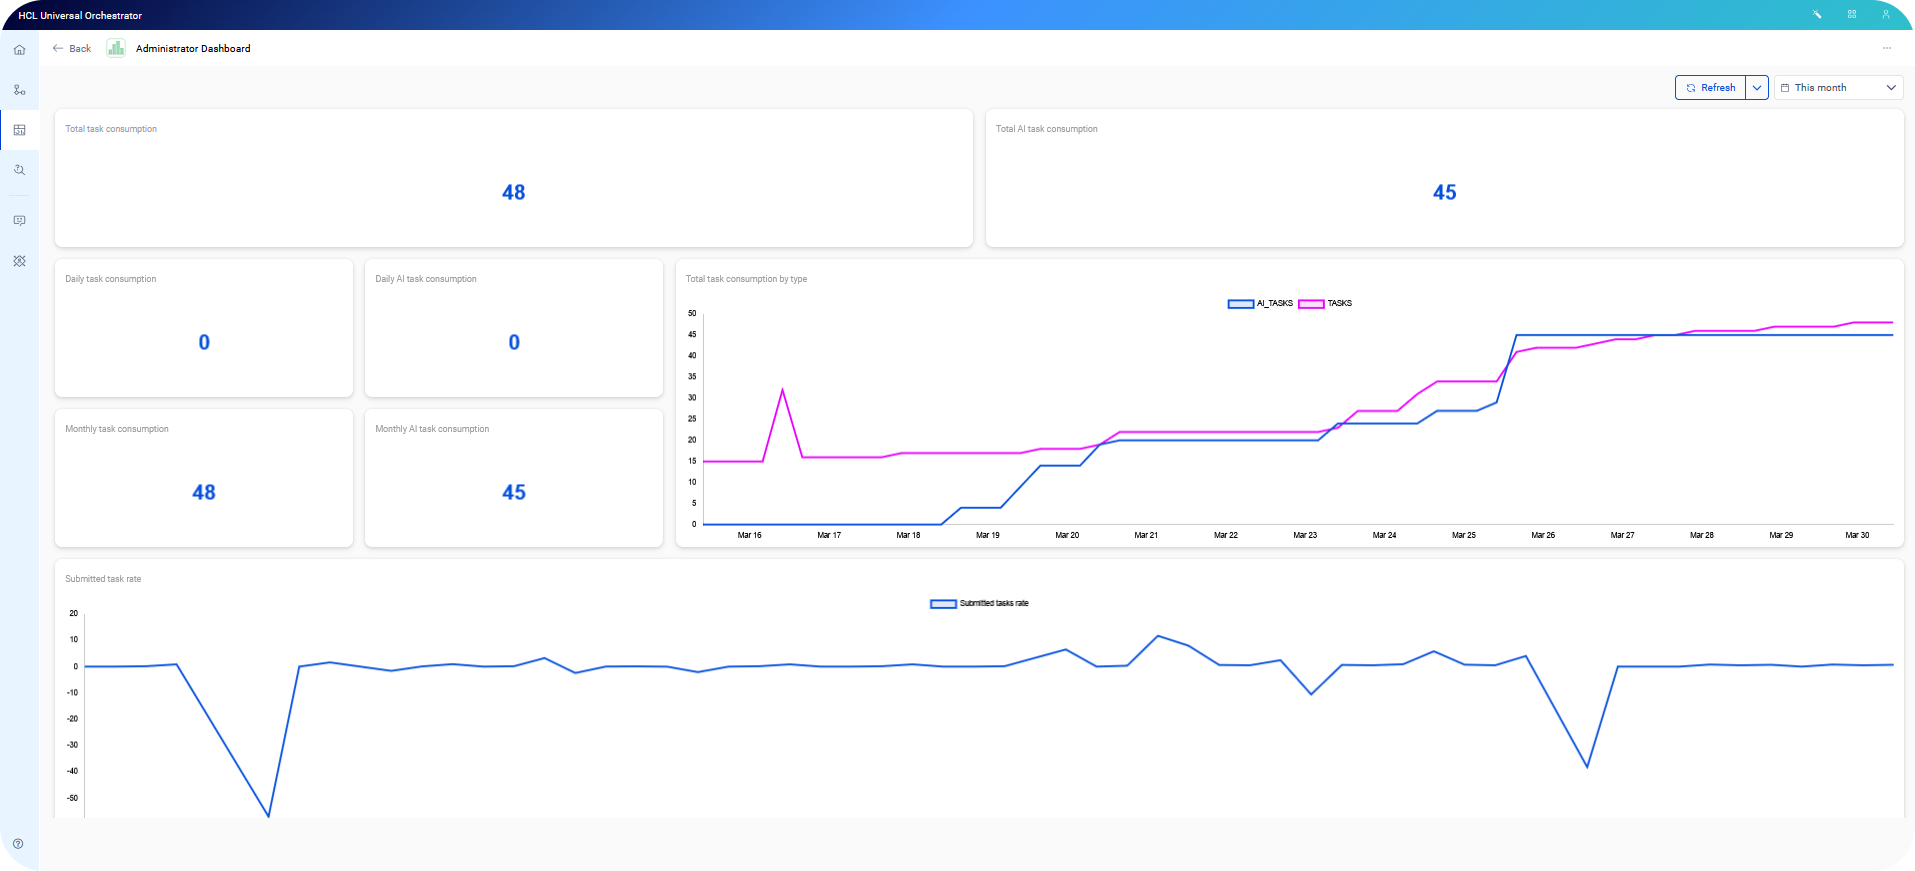
Versatile widget options: Customize your monitoring experience with two primary visualization styles:
  • Time-series: Identify patterns and peaks by tracking metric fluctuations over time. Use the Group By feature to segment data by folder or workstation for deeper analysis.
  • Gauge & KPI: Get instant status updates. Use the Standard Gauge with color thresholds to visualize thresholds, or use KPI Mode for a streamlined numerical view of key data points.


Advanced Filtering with OQL: Take control of your data using Orchestration Query Language. You can now write custom queries directly within the widget configuration to filter by specific numeric values or string patterns.

Find out more about dashboards in Monitoring your workload with dashboards.