Open iAutomate Web URL and login with Organization Admin credentials.
On the main menu bar, click Dashboard.Figure 1. Dashboard Menu
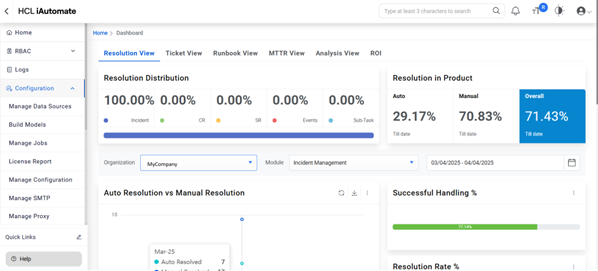
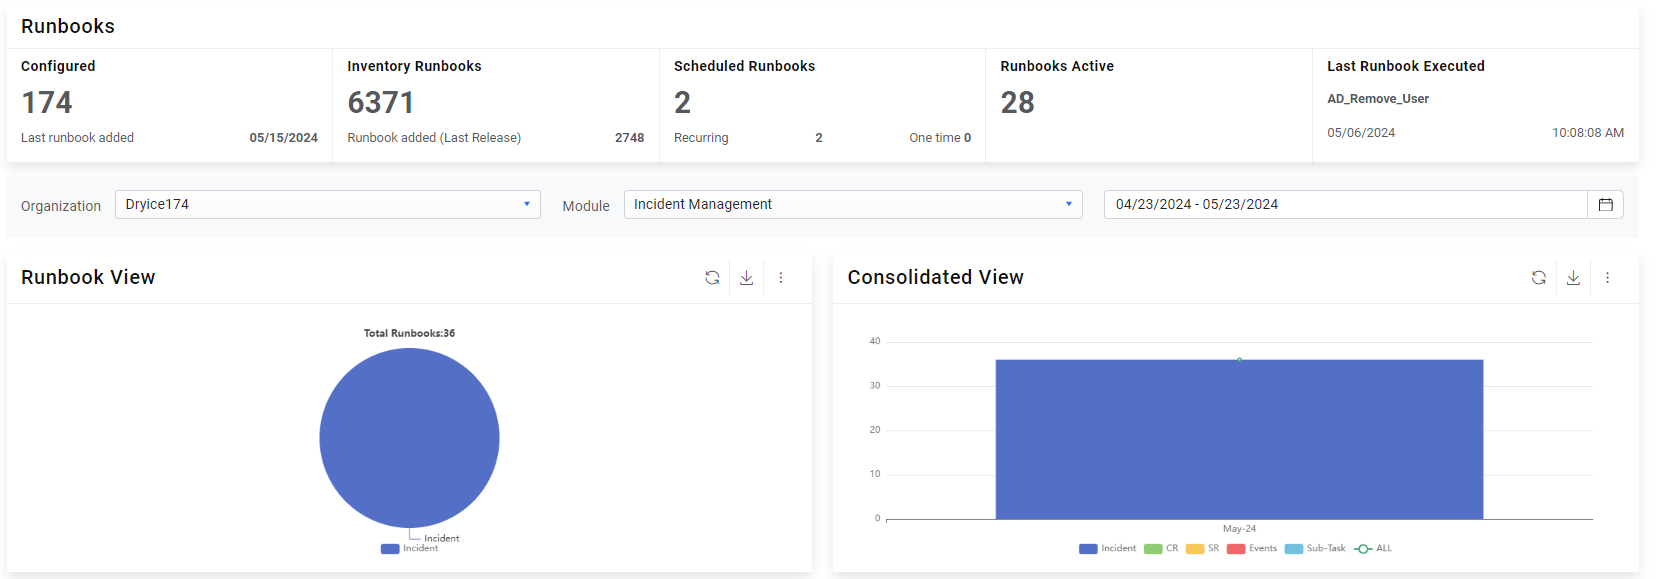
The Dashboard appears.Figure 2. Dashboard View
The Dashboard Filters allow users to narrow the range of one or
more reports on the active Dashboard tab. This filter lets you select a specific time frame,
such as last month, current month, last quarter, or a range of dates.
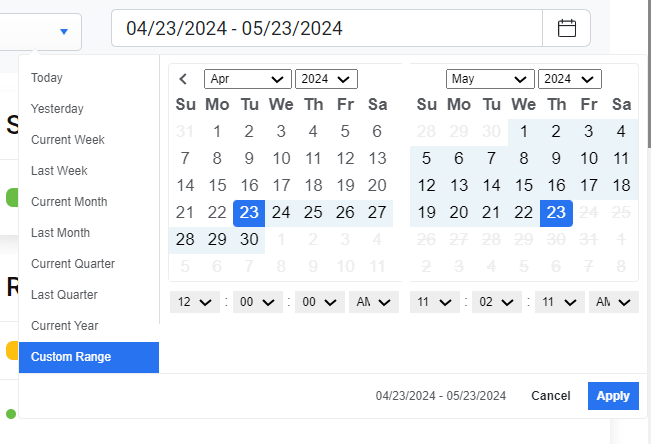
To configure a specific report, select the Organization from the drop-down list, then
select the time frame from the drop-down list of the Period, and then select the date range
in the From Date and To Date fields. For this exercise, select the current month.Figure 3. DashboardFigure 4. Dashboard (Cont.)
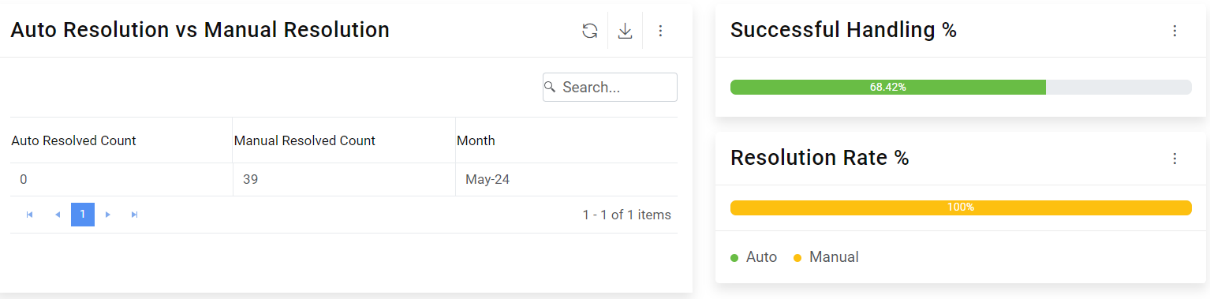
Widgets under Dashboard Filters are now divided into parts and placed across the screen in
new UI. To check each one user can now directly go to that section and view the detailed
description.Figure 5. Dashboard
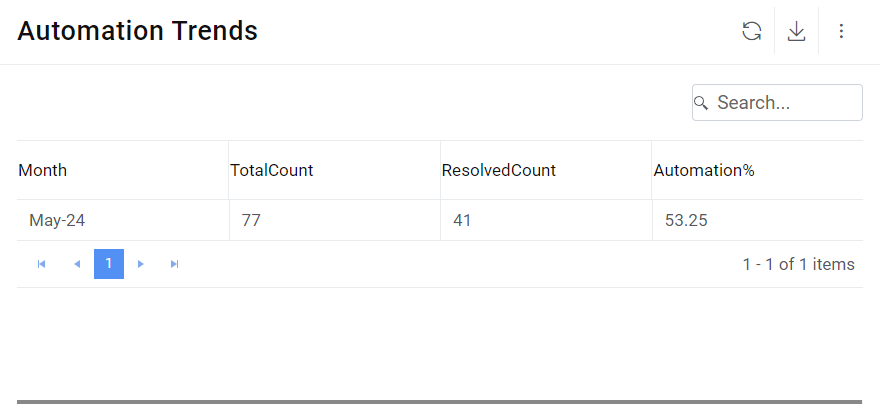
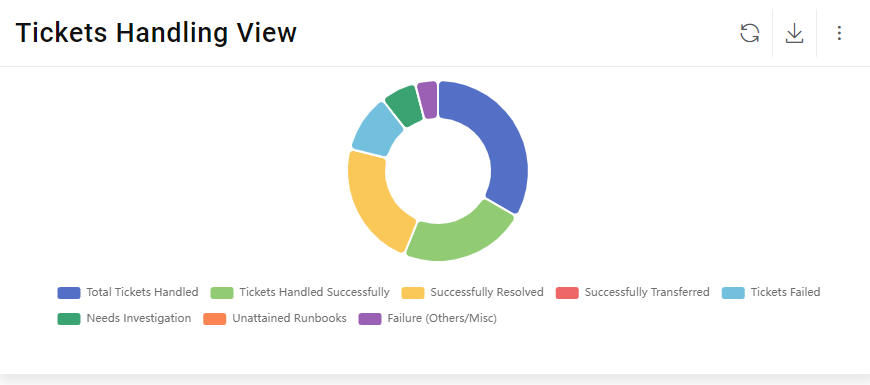
You can view Ticket Handling details of report appearing on the UI.
To the Ticket Handling Details, perform the following steps –
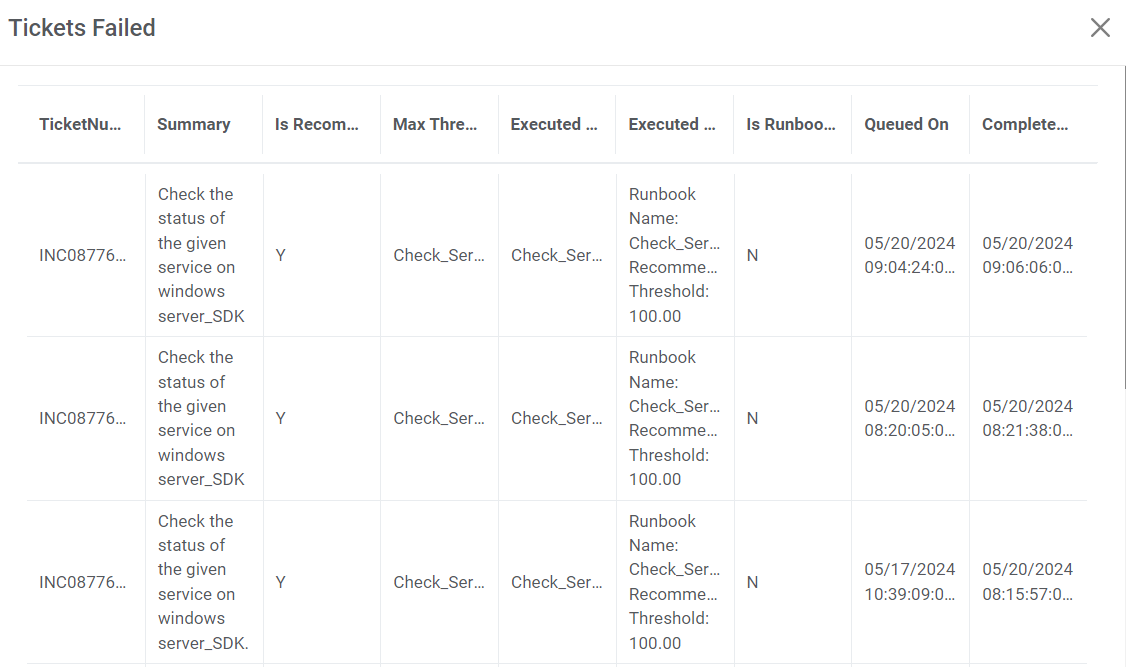
Click any visualization to view details of the Ticket Handling.Figure 6. Tickets Handling View
The Ticket Handling View is displayed.Figure 7. Tickets Handling View (Cont.)