Self-Heal Analytics
- Self-heal Analytics provides graphical reports of executed solutions within the Client portal.
- Admin can view these reports in various graphical representations.
- Admin can filter by month and view the reports specific to that month.
Figure 1. Self-Heal Dashboard 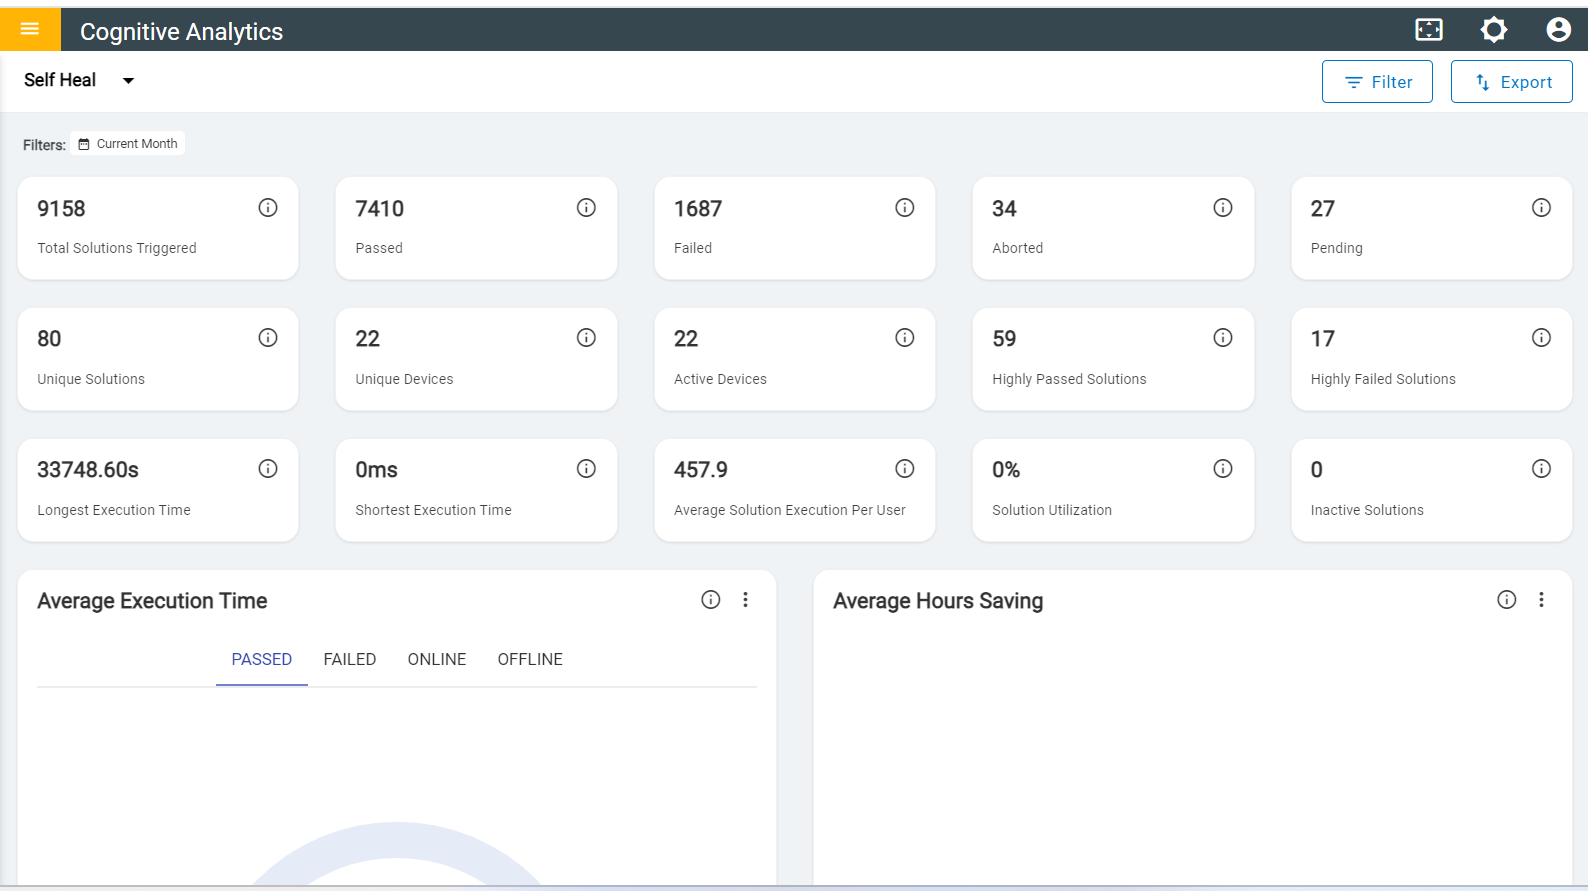
- In the first row, there are 5 cards that have metrics in number format.
Figure 2. First Row Number Metrics 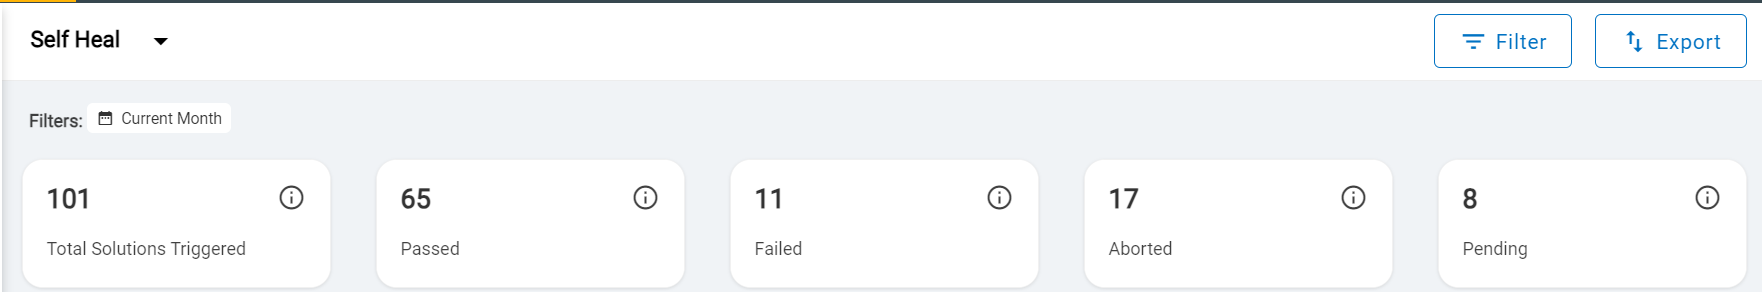
- Total Solutions Triggered: Number of Solutions triggered within a specified period.
- Passed: Number of scripts that have successfully completed their execution within specified period
- Failed: Number of scripts that did not successfully complete their execution within specified period.
- Aborted: Number of scripts that were terminated or prematurely stopped before their completion within specified period.
- Pending: Number of scripts that were initiated for execution, but the operation is waiting to be processed, remaining pending.
- In the second row, there are 4 cards that have metrics in number format.
Figure 3. Second Row Number Metrics 
-
Unique Solutions: The total count of unique solutions executed.
- Example: If we have five solutions, each solution is executed twice. This means the scripts are triggered a total of ten times. However, the number of unique solutions remains five, regardless of how many times a user executes them.
-
Unique Devices: The total count of unique devices utilized to execute scripts.
- Example: If a user uses three devices but installs the self-heal app on only two of them, the count of unique devices is two.
-
Active Devices: The total count of devices that executed at least one solution.
- Example: If a user operates three devices but runs the solution only on one device, leaving the others idle, the total count of active devices is one.
-
High Passed Solution: The total number of solutions that have passed, with a
passed rate 50% higher.
- Example: If a specific month, the success rate of a solution can be calculated as follows: (Number of times the solution passed / Total number of times the solution was executed) * 100. For instance, if the "Chrome is not working" solution was executed 10 times and failed 6 times, it would be categorized as a solution with a high passed rate. The number of solutions with a high passed rate is one.
-
High Failed Solution: The total count of solutions that have failed, with a
failure rate of 50% or higher.
- Example: For a specific month, the failure rate of a solution can be calculated as follows: (Number of times the solution failed / Total number of times the solution was executed) * 100. For instance, if the "Chrome is not working" solution was executed 10 times and failed 6 times, it would be categorized as a solution with a high failure rate. The number of solutions with a high failure rate is one.
-
Unique Solutions: The total count of unique solutions executed.
- In the third row, there are five cards that have metrics in number format.
Figure 4. Third Row Number Metrics 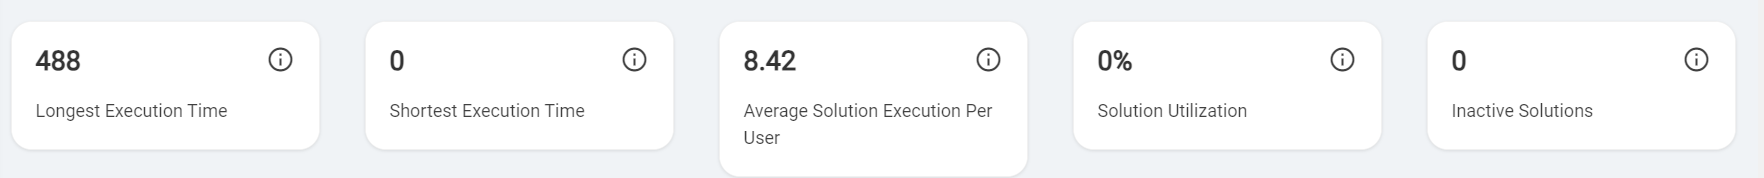
- Longest Execution Time: Longest Execution time (Seconds) among all solutions that were triggered.
- Shortest Execution Time: Shortest Execution time (Seconds) among all solutions that were triggered.
- Average Solution Execution Per User: Average count of solutions executed per user.
- Solution Utilization: Percentage of solutions utilized per user.
- Inactive Solutions: Count of solutions that were not utilized by users.
- In the Fourth row, there are two graphs.
Figure 5. Fourth Row of Self-Heal Dashboard 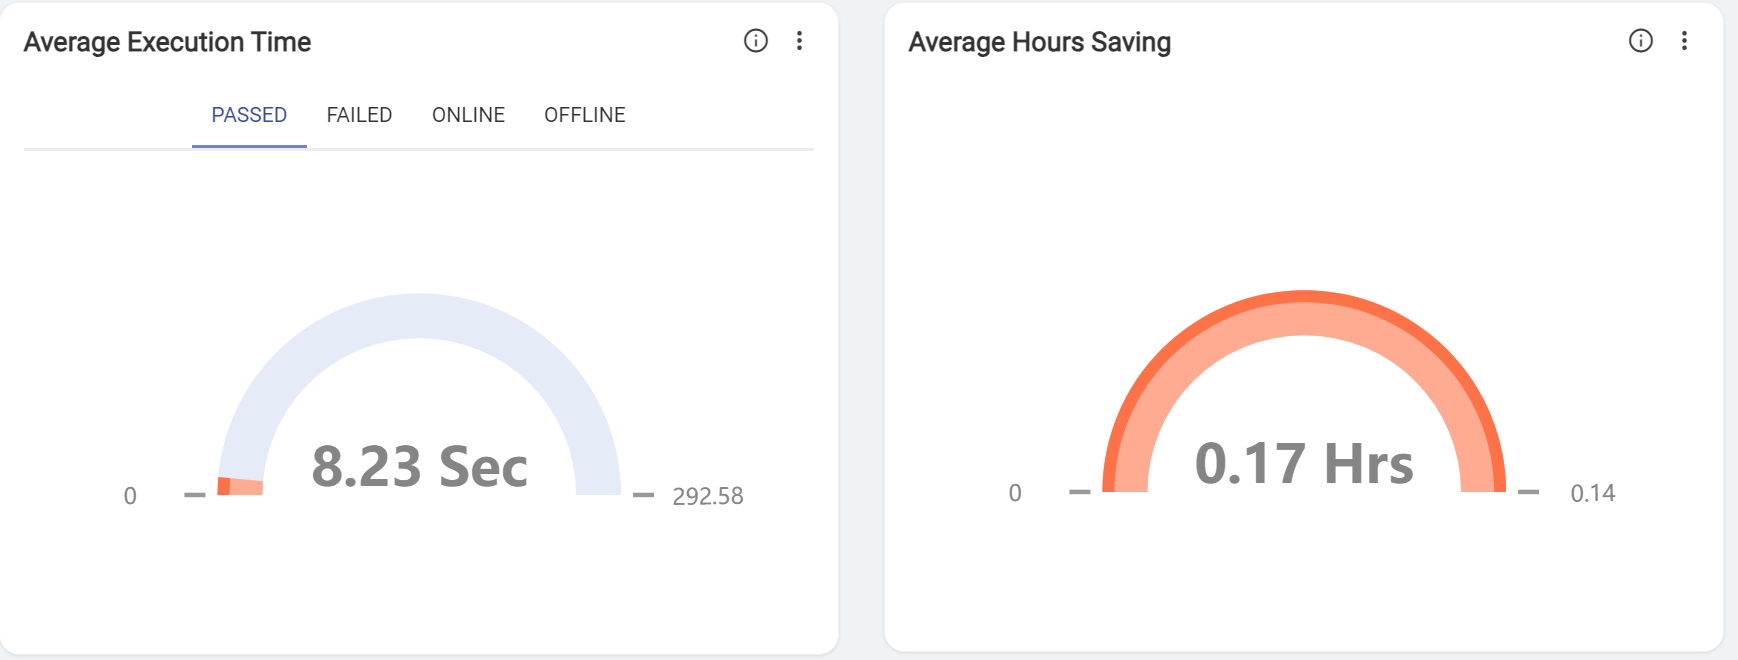
-
Average Execution Time: Average passed execution graph represents the average
time taken by solutions which are executed successfully. The average Failed execution
graph represents the average time taken by solutions which failed to execute. The
average online execution graph represents the average duration of a solution executed
online. The average offline execution graph represents the average duration of solutions
executed offline.
- The numbers on the left side show the minimum execution time, whether passed or failed, for a solution in seconds, while those on the right side indicate the maximum execution time, whether passed or failed, in seconds.
- Average Hours saving: Average hours savings graph represents the average hours saved by all solutions while executing.
-
- The numbers on the left side show the minimum execution time for all solutions measured in hours, whereas those on the right side represent the maximum execution time for all solutions, in hours.
-
Average Execution Time: Average passed execution graph represents the average
time taken by solutions which are executed successfully. The average Failed execution
graph represents the average time taken by solutions which failed to execute. The
average online execution graph represents the average duration of a solution executed
online. The average offline execution graph represents the average duration of solutions
executed offline.
- In the fifth row, there is one graph Performance of Solution Types Across Execution Status
-
Performance of Solution Types Across Execution Status: 2D graph represents the
total number of scripts triggered based on execution status associated with a particular
solution type.
Figure 6. Performance of Solution Types Across Execution Status 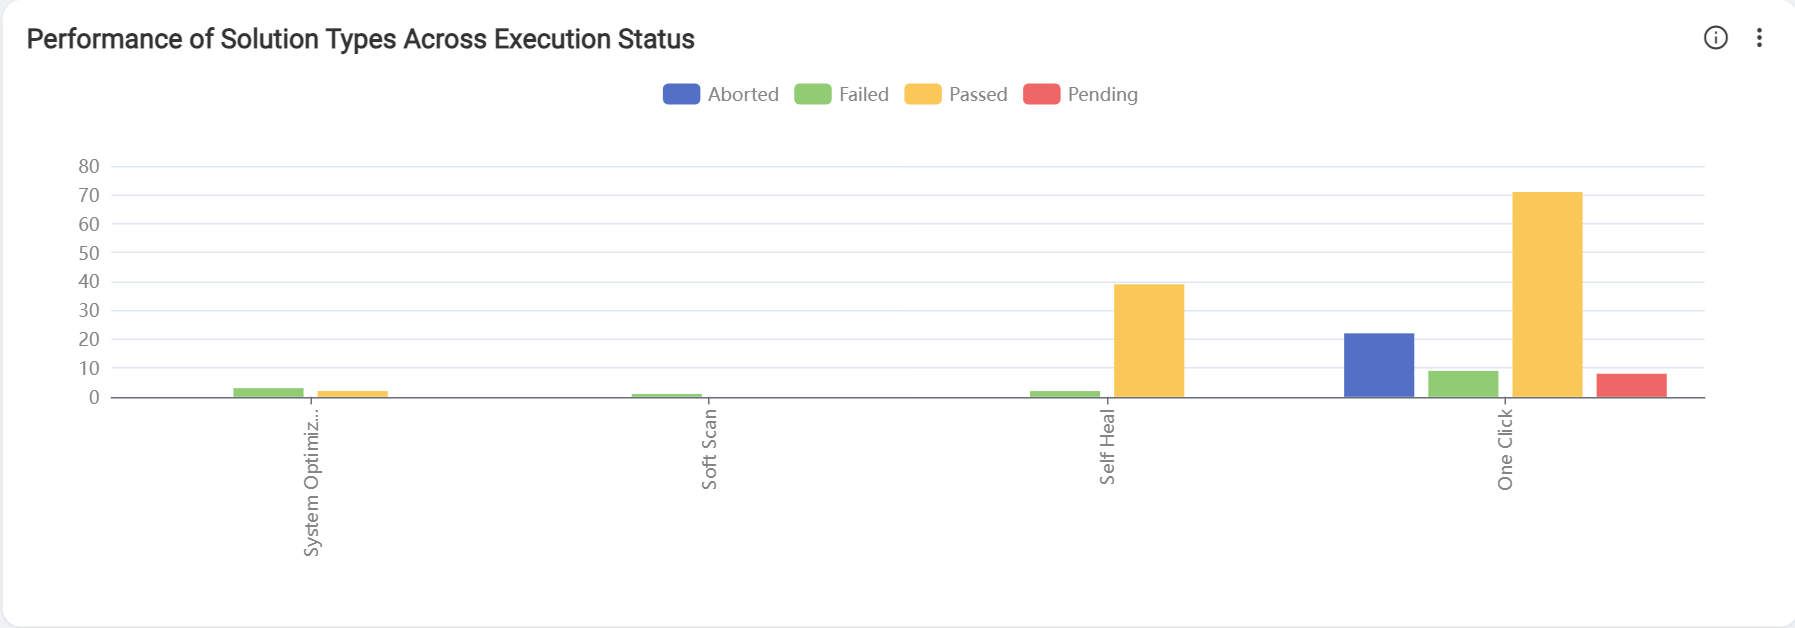
-
Performance of Solution Types Across Execution Status: 2D graph represents the
total number of scripts triggered based on execution status associated with a particular
solution type.
- In the sixth row, Average Execution time by solution.
- Average Execution time by solution: Graph represents the average execution time for each solution by their execution status.
-
Figure 7. Average Execution time by solution 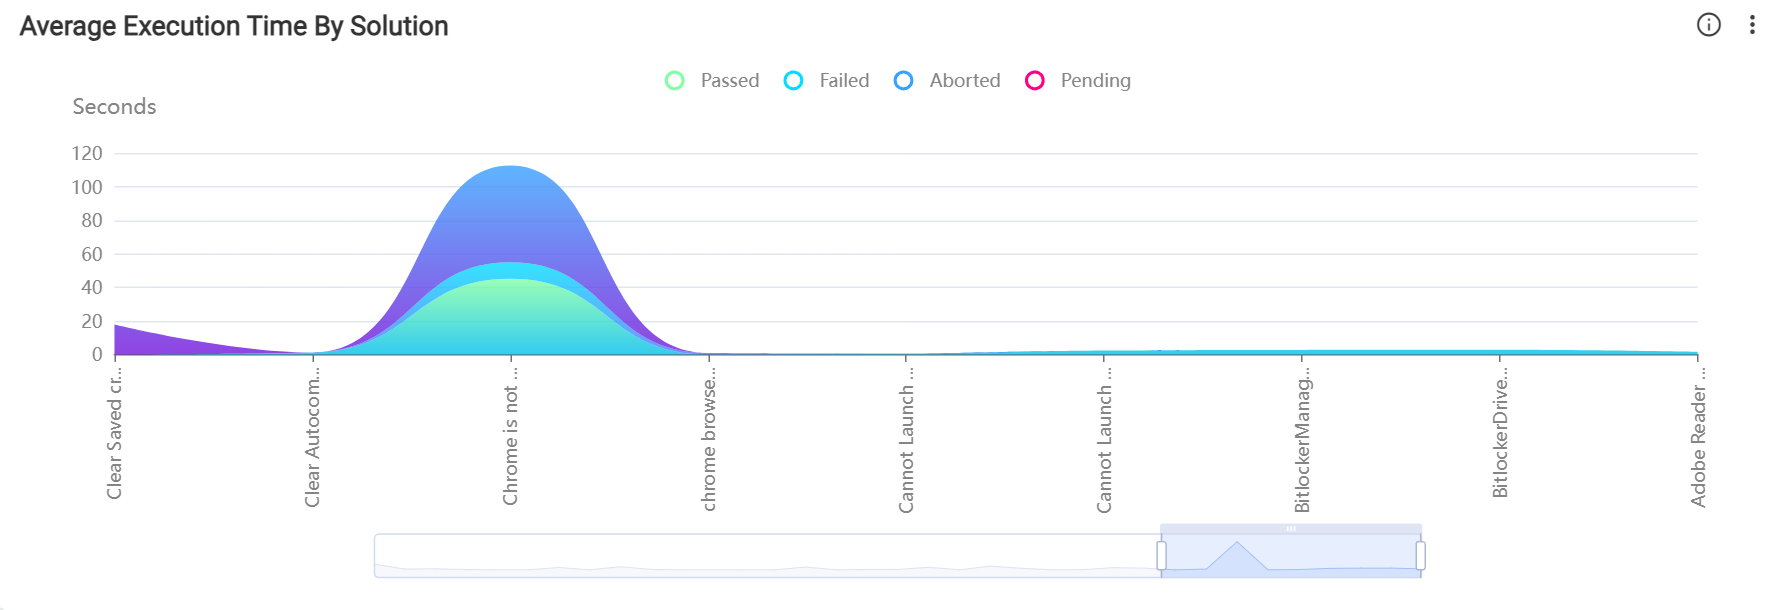
- In the seventh row, there is one graph of the average hours saved by solution.
- Graph represents average hours saved by each solution.
Figure 8. Average Hours Saved by Solution 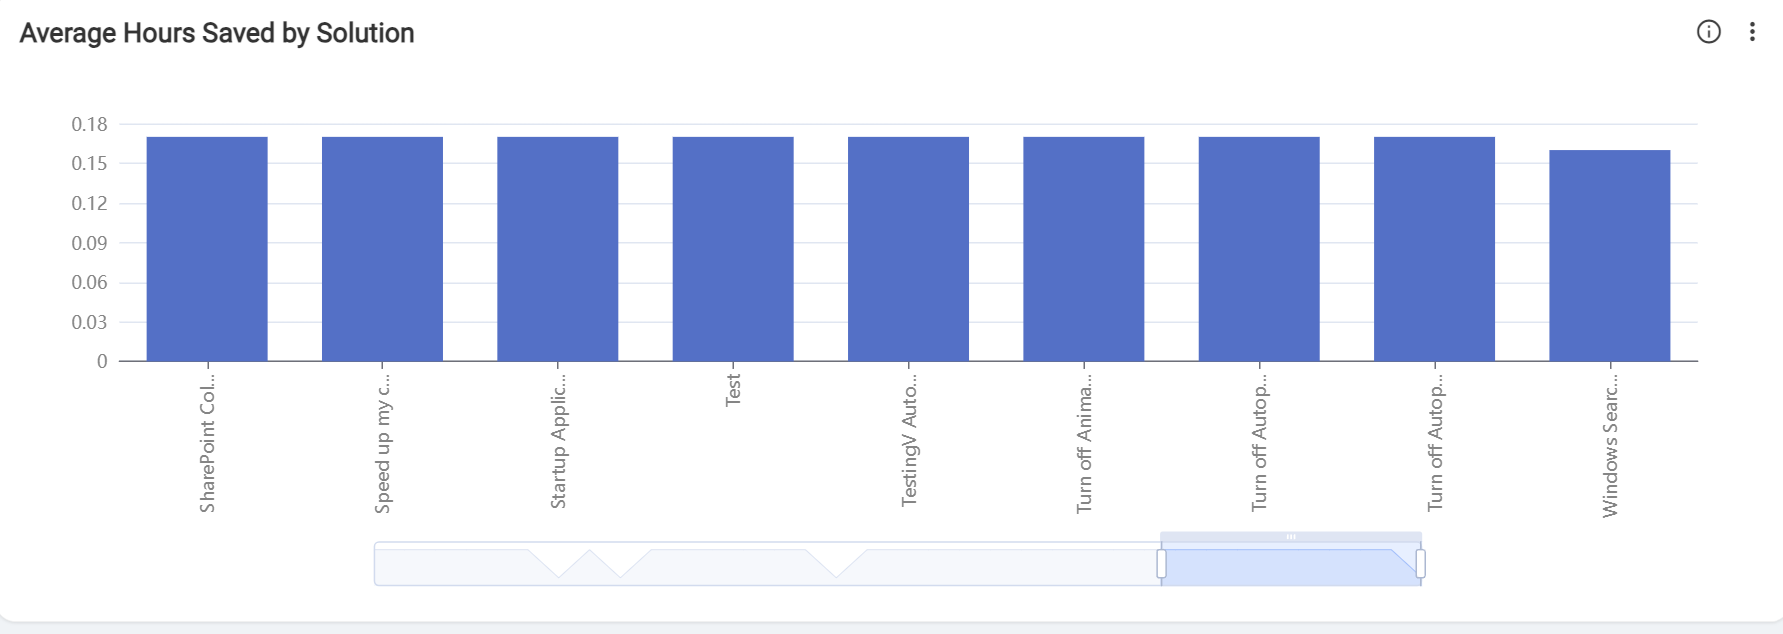
- In the eighth row, there is Execution time by solution.
Figure 9. Execution Time by Solution 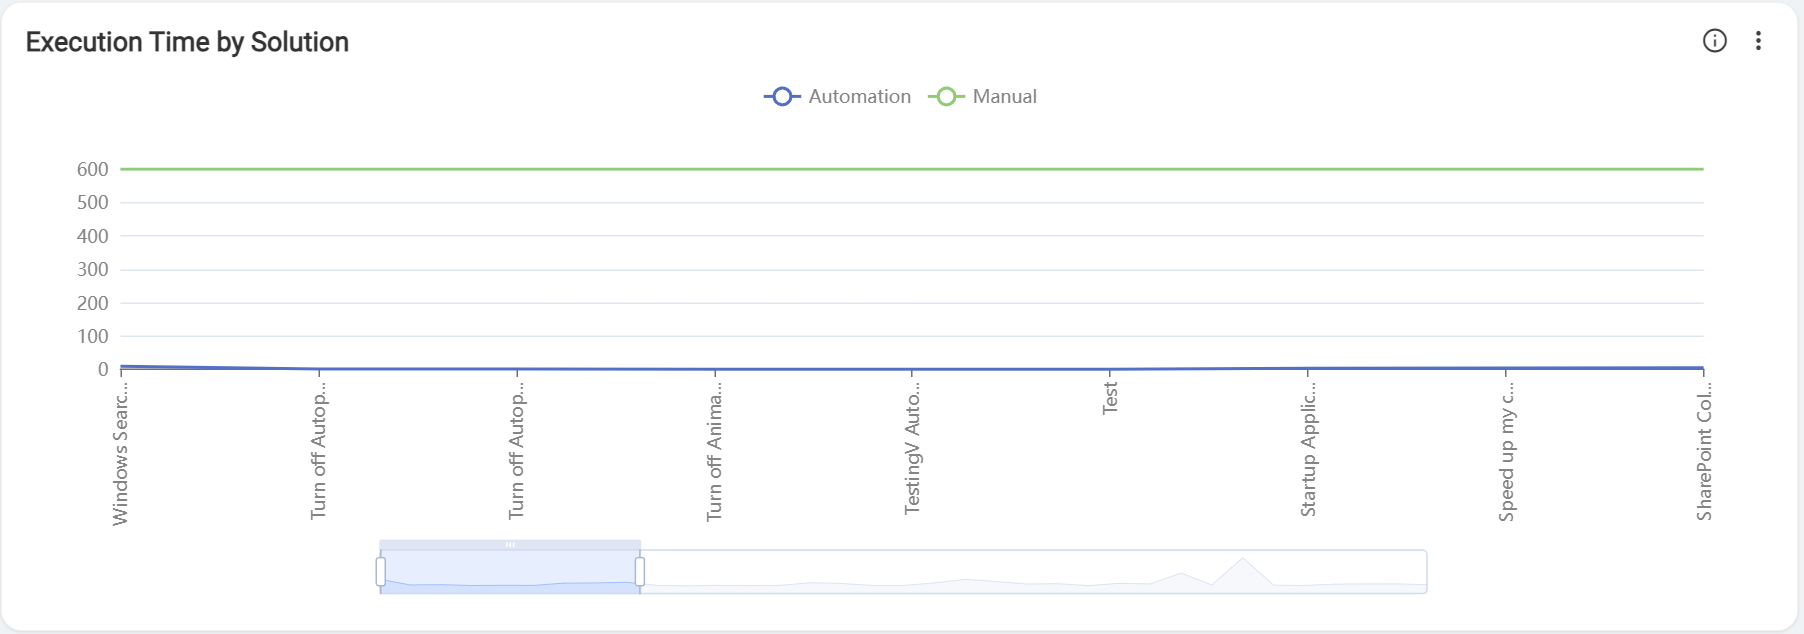
Automation execution time graph represents actual time(sec) taken by solutions to execute manual execution time graph represents manual or default execution time(sec) for the solution.
- In the ninth row, there are solutions based on category.
-
Count: Graph represents the number of times solutions have been executed in a
particular period based on various mentioned categories.
Figure 10. Count Graph 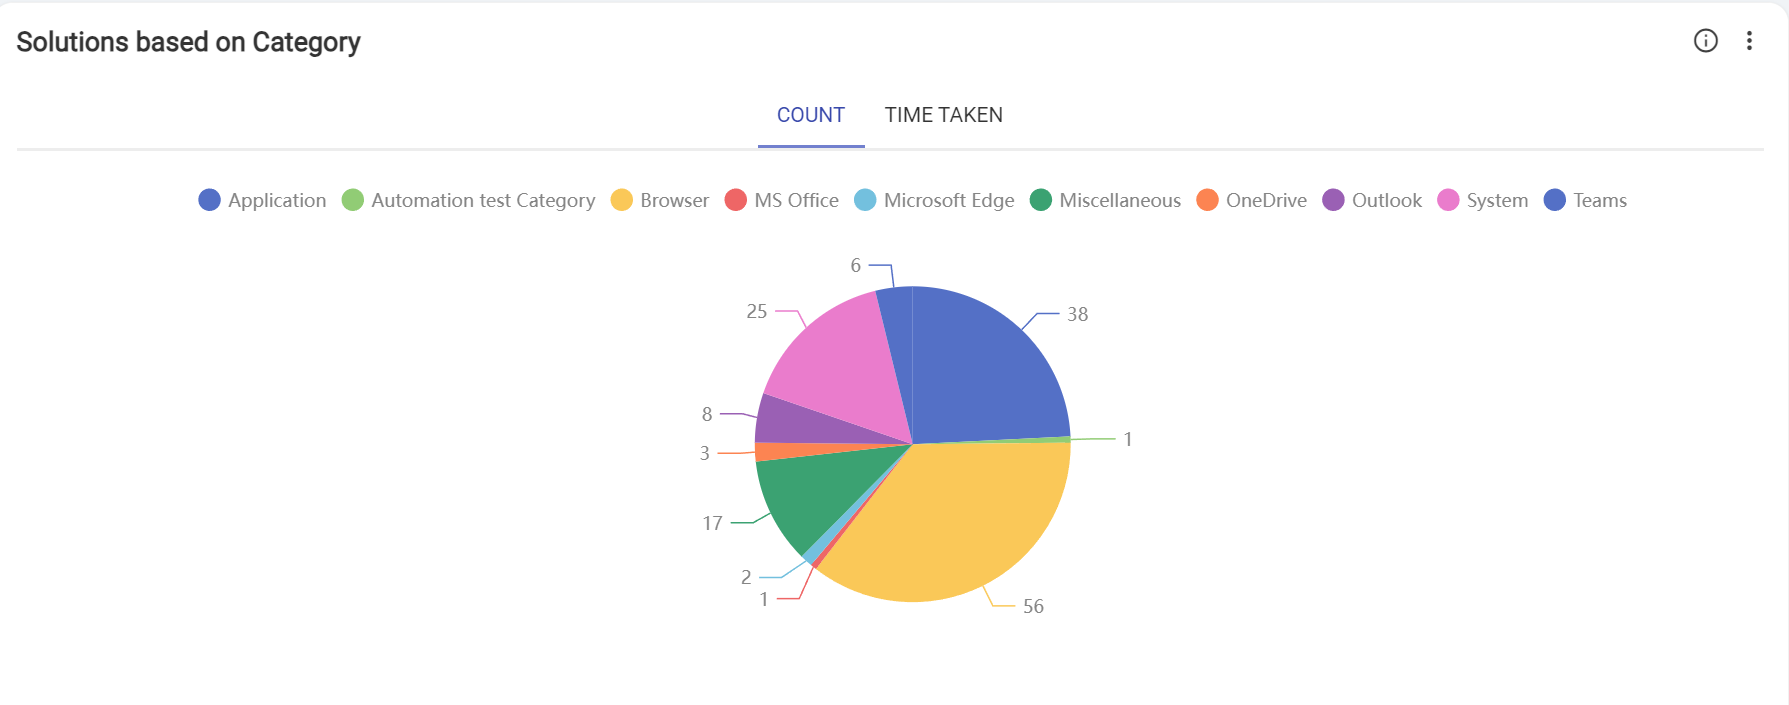
-
Time Taken: This graph illustrates the total time duration in hours for each
category, determined by the execution of all solutions within the same category.
Figure 11. Time Taken Graph 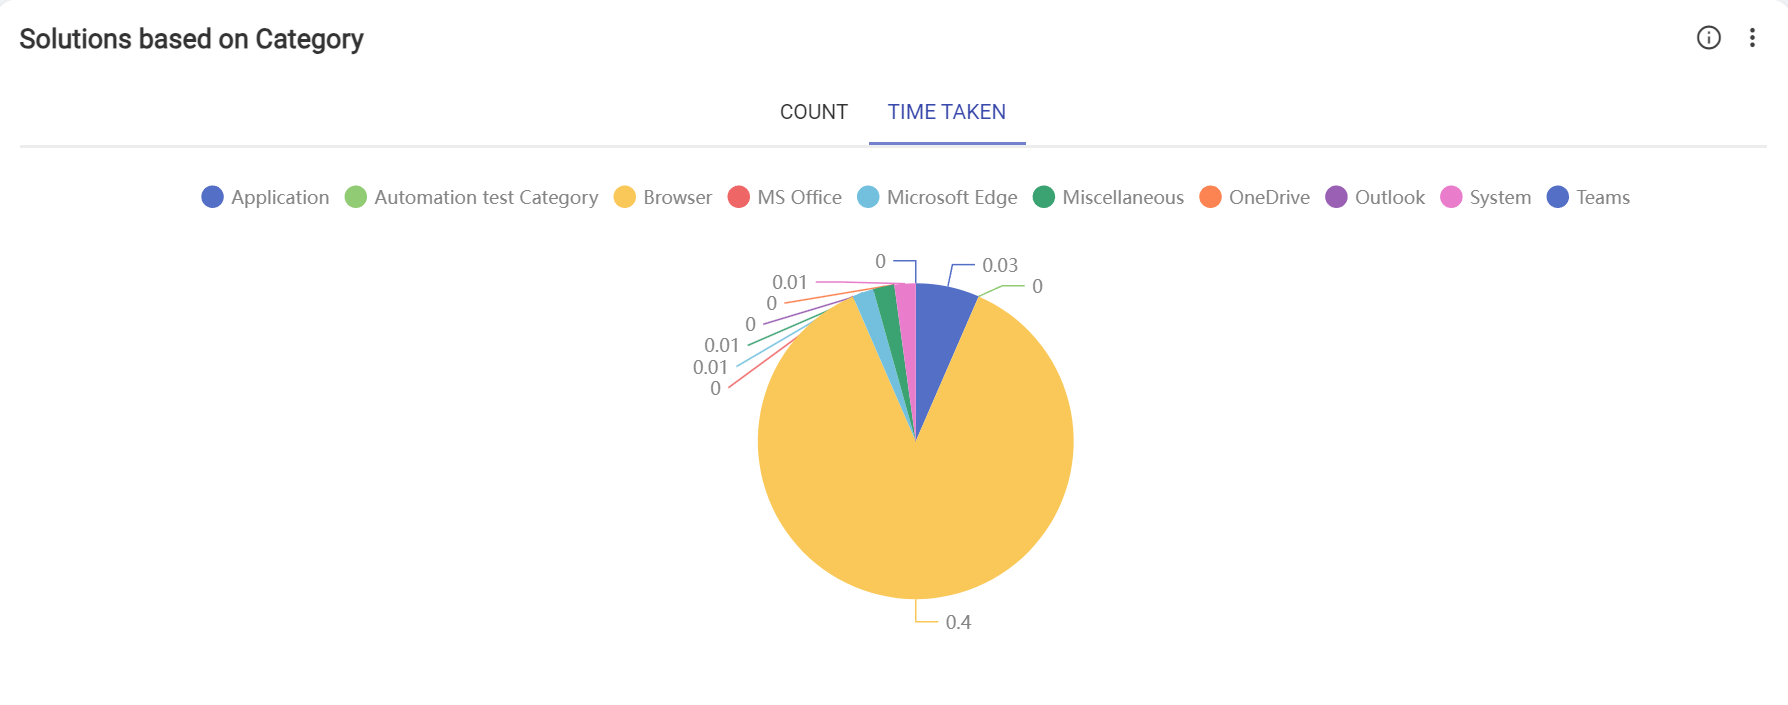
-
Count: Graph represents the number of times solutions have been executed in a
particular period based on various mentioned categories.
- In the Tenth row, there are two graphs.
- Scripts based on execution status: Graph represents the comparison between number of solutions that have successfully completed (passed), number of solutions that did not successfully complete (Failed) and number of solutions that were terminated or stopped before execution (Aborted) and number of solutions that were initiated for execution, but the operations is waiting to be processed, remaining in a pending(pending).
-
Scripts based on execution mode: This graph depicts the count of solutions
executed based on two different modes online and offline.
Figure 12. Seventh Row of Self-Heal Dashboard 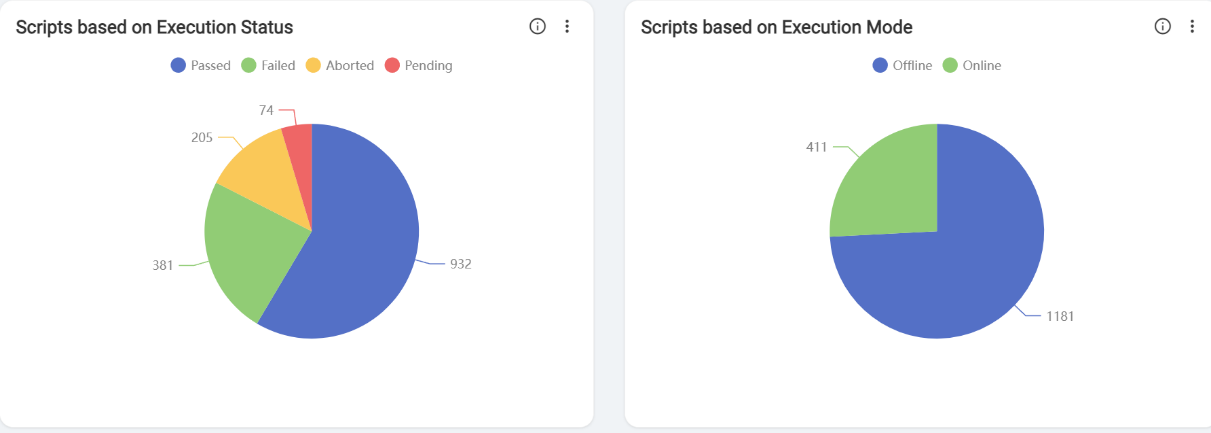
- In the eleventh row, there is one graph.
-
Unique users per solution: This graph depicts the total count of unique users for
each solution.
- Example: User1 executed the solution twice, and User2 executed them three times, but the count stays at two due to the two unique users involved. This solution was implemented by two different users, irrespective of how many times each executed it.
Figure 13. Eleventh Row of Self-Heal Dashboard 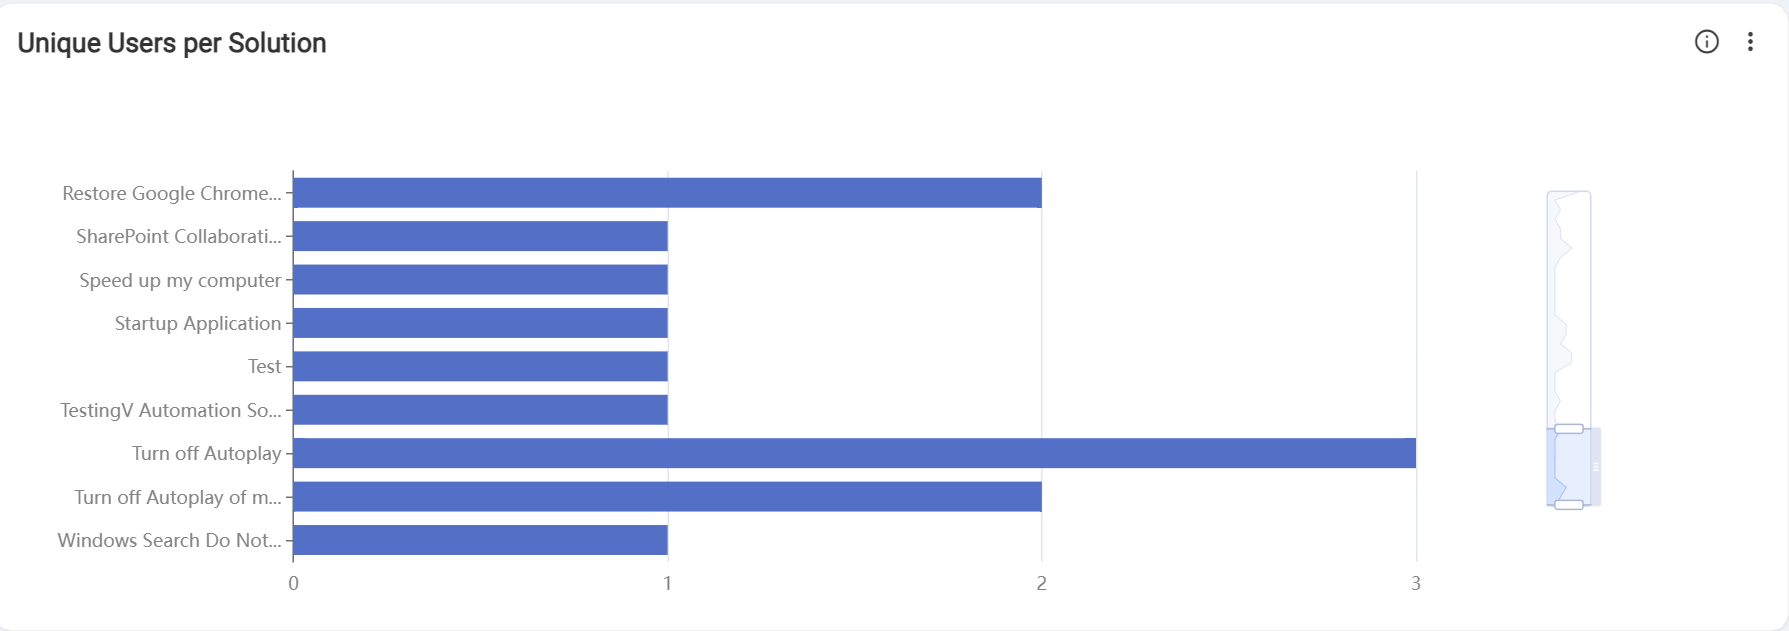
-
Unique users per solution: This graph depicts the total count of unique users for
each solution.
- In the Twelfth row, there is a script table.
-
Solutions:
The table represents the list of scripts available along with total count and denotes the number of times that scripts have been triggered.
- Passed, Failed, Aborted and Pending execution status percentages indicate the impact of that script. Impact denotes the overall impact of that solution on all executions. It also provides information on which category and solution type of each script.
-
Solutions:
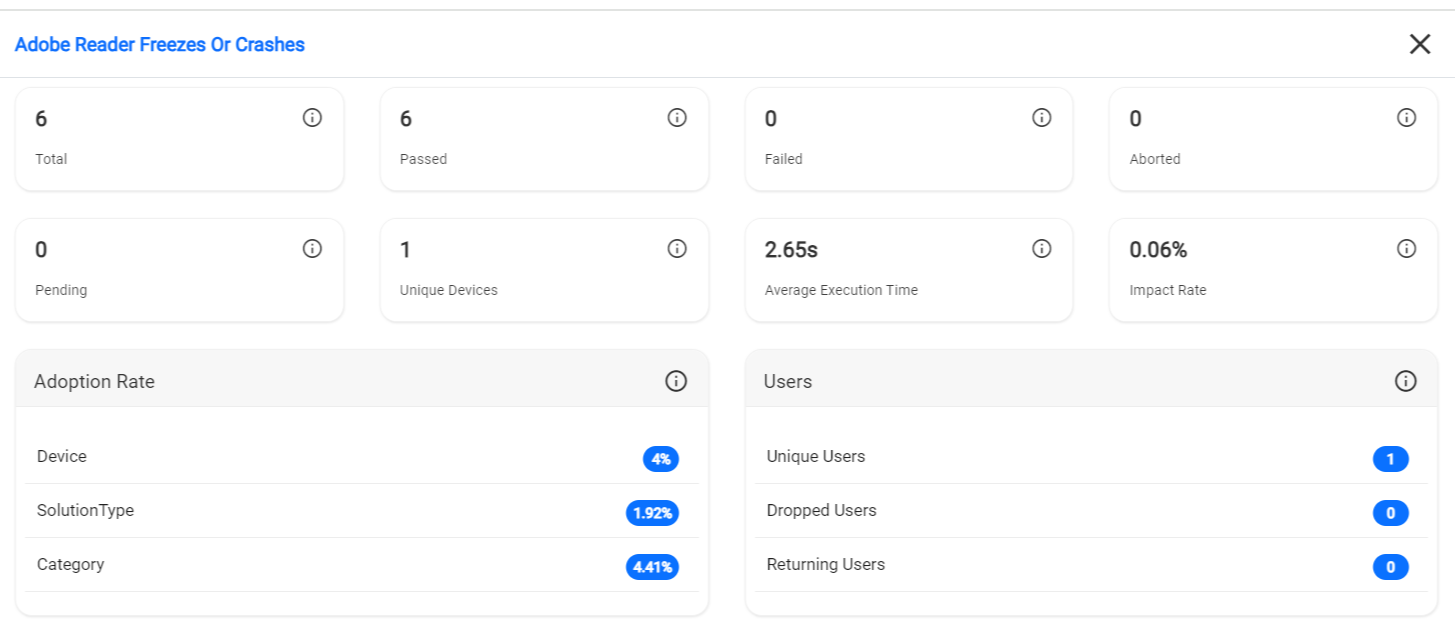
- Click the details icon to View additional information about each individual solution.
Figure 14. Solutions 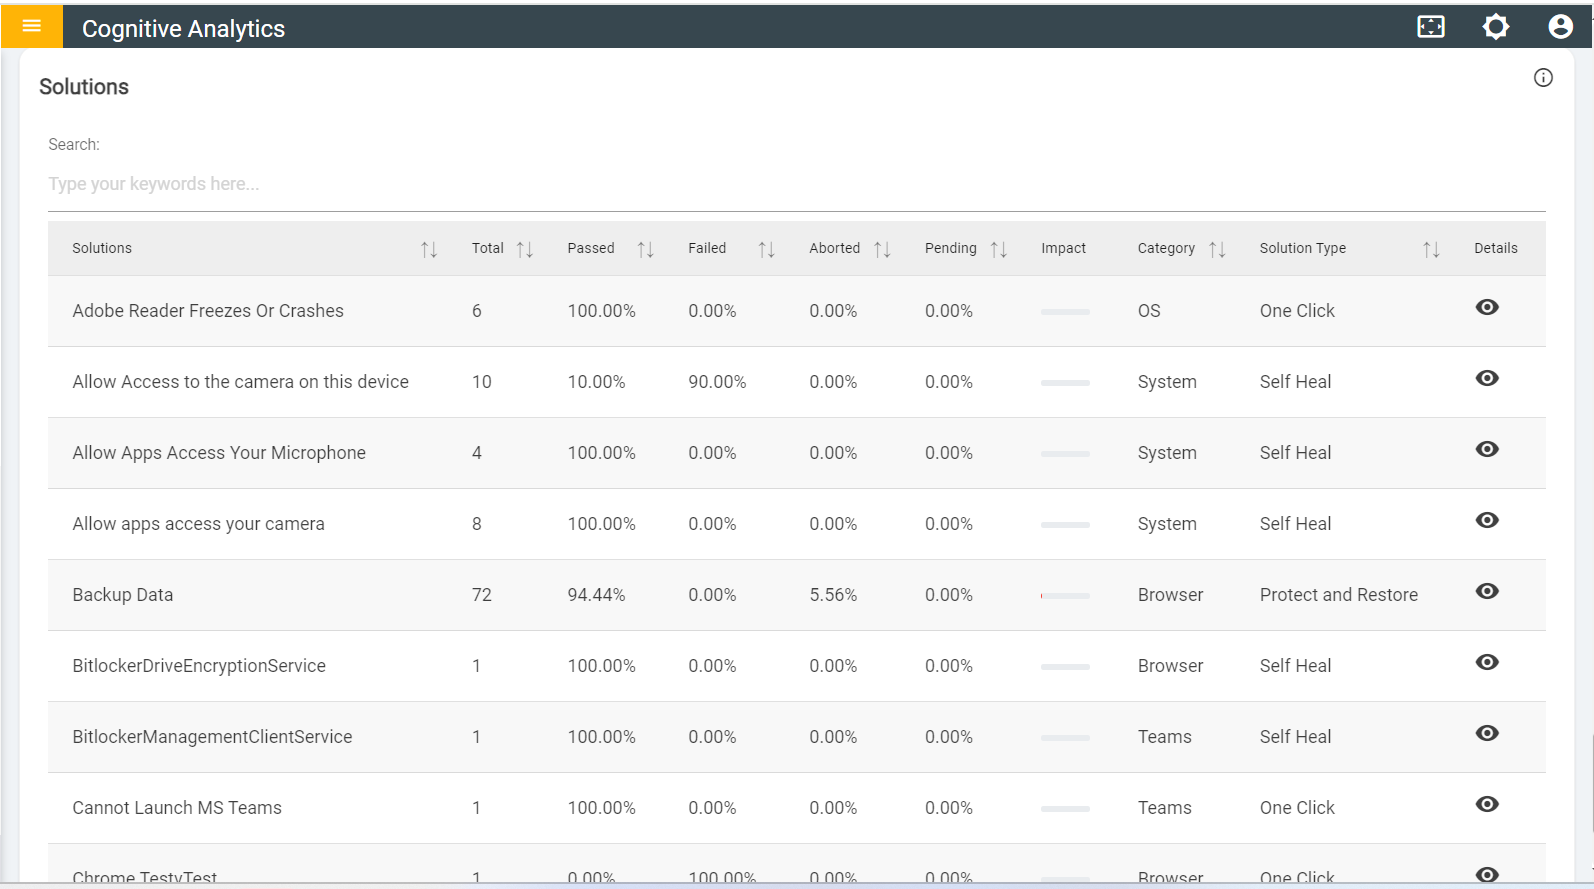
- If User Clicks on view icon the following page appears.
Figure 15. View Icon Details