Leaderboard
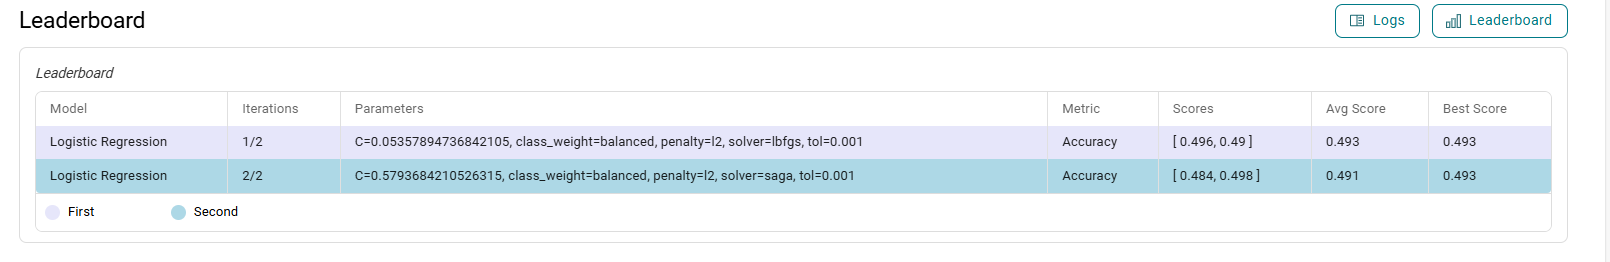
The Leaderboard displays the performance summary of all trained models, helping users identify the best configurations at a glance.
![]()
Each row represents a unique set of hyperparameters, such as regularization strength, class weight, penalty type, and solver used.
The Iterations column shows the model’s run order out of the total training attempts.
The Metric (e.g., Accuracy) indicates which evaluation criterion was used to assess performance. The Scores column lists evaluation results across multiple validation splits or folds.
Avg Score and Best Score highlight the overall and peak performance respectively.
To aid quick analysis, the system uses distinct colors: the top-performing model is marked in silver, and the second-best in bronze, making comparison across multiple models both intuitive and efficient.