Get: Bivariate Analysis
Explores relationships between two features using diverse plot types and correlation mapping.
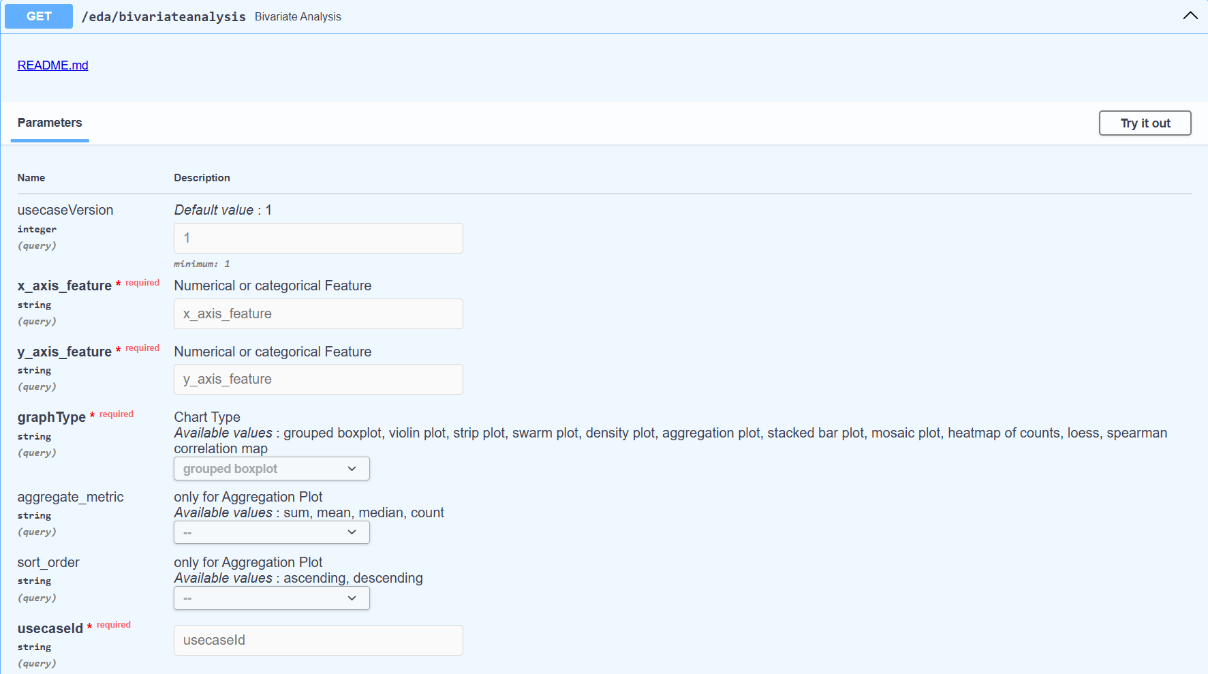
Endpoint:
/eda/bivariateanalysis
Input Parameters:
- usecaseVersion (integer, default: 1)
- x_axis_feature (string, required)
- y_axis_feature (string, required)
- graphType (string, required: grouped boxplot, violin plot, strip plot, swarm plot, density plot, aggregation plot, stacked bar plot, mosaic plot, heatmap of counts, loess, spearman correlation map)
- aggregate_metric (string, optional; only for aggregation plots: sum, mean, median, count)
- sort_order (string, optional; only for aggregation plots: ascending, descending)
-
usecaseId (string, required)
Output:
JSON with visualizations and insights on joint distribution, trends, and correlations.