Troubleshooting
Selftests
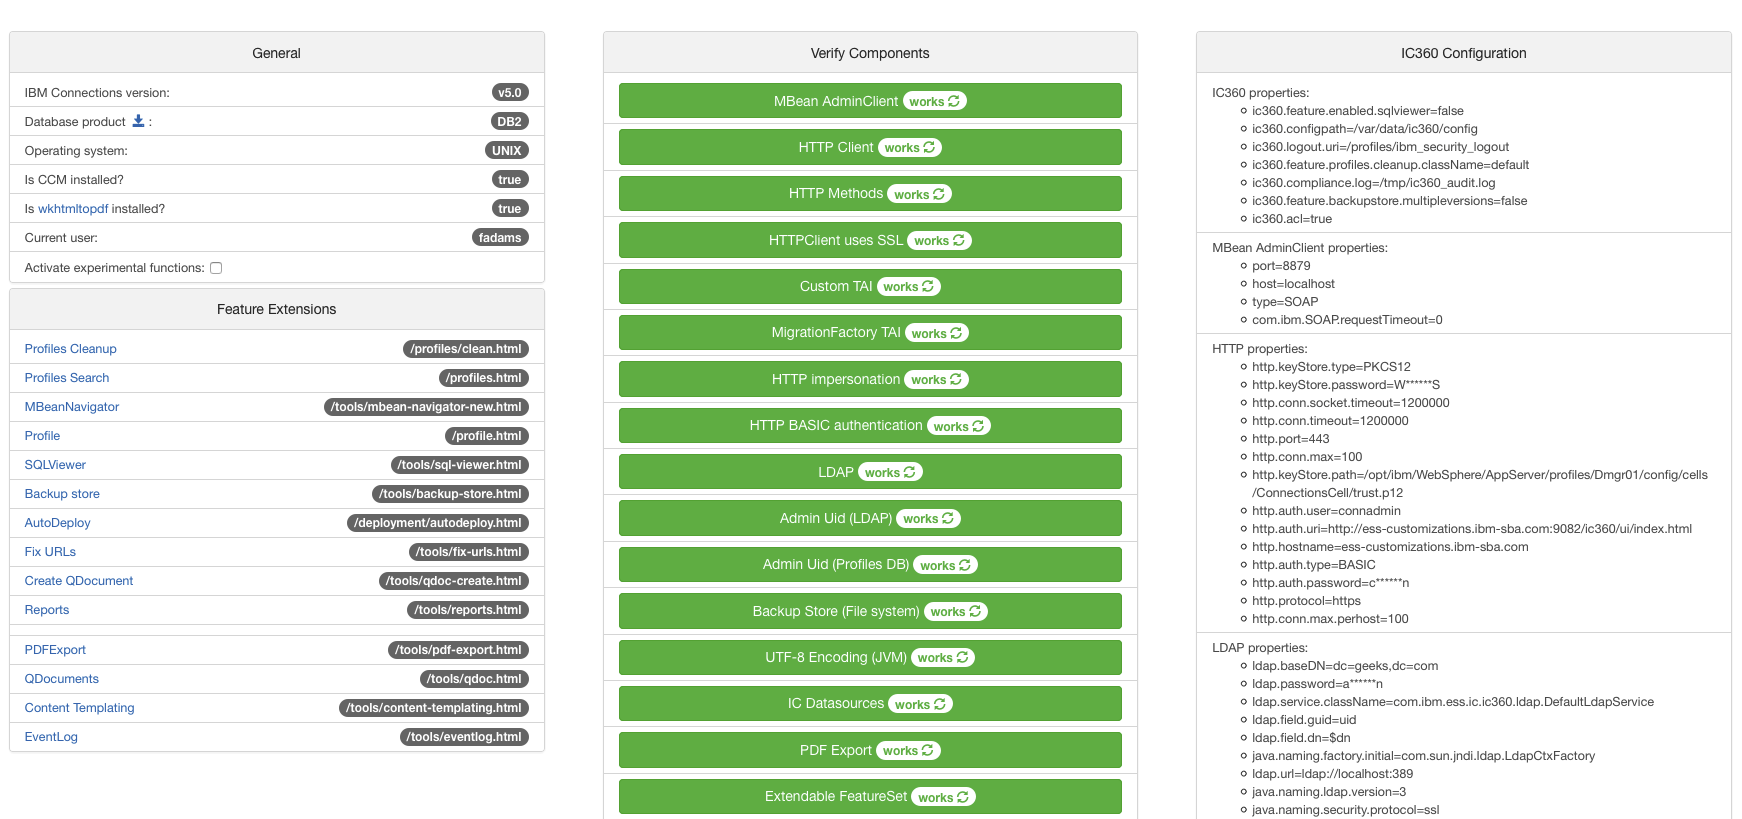
Open the browser and navigate to the Selftest page of ICXT (Note: Only accessible for ICXT administrative users)

Verify, if all features and functions are working as expected:
Server/Applications Status
The first thing to check when running into issues with the ICXT application (or the PDF Export and Tailored experience community templating feature) is whether server the applications are installed on started OK and whether the individual applications were able to start up and are in a running state.
-
ICXT server status
Navigate to Servers > Application servers

-
ICXT applications status
Navigate to Applications > Application Types > WebSphere enterprise applications
If server/applications are not in running status that means something went wrong . We can add Log setting to further investigate issue either from ic360/ui or WebSphere console
Log settings
Server-side
Following trace settings should be applied in order to trace down server-side errors:
*=info:
com.ibm.ess.ic.ic360.rest.impl.*=fine:
com.ibm.ess.ic.ic360.ui.api.*=all:
com.ibm.ess.ic.ic360.mod.backupstore.api.*=all:
com.ibm.ess.ic.ic360.mod.profiles.api.*=all:
com.ibm.ess.ic.icxt.contentmanagement.tasks.*=all
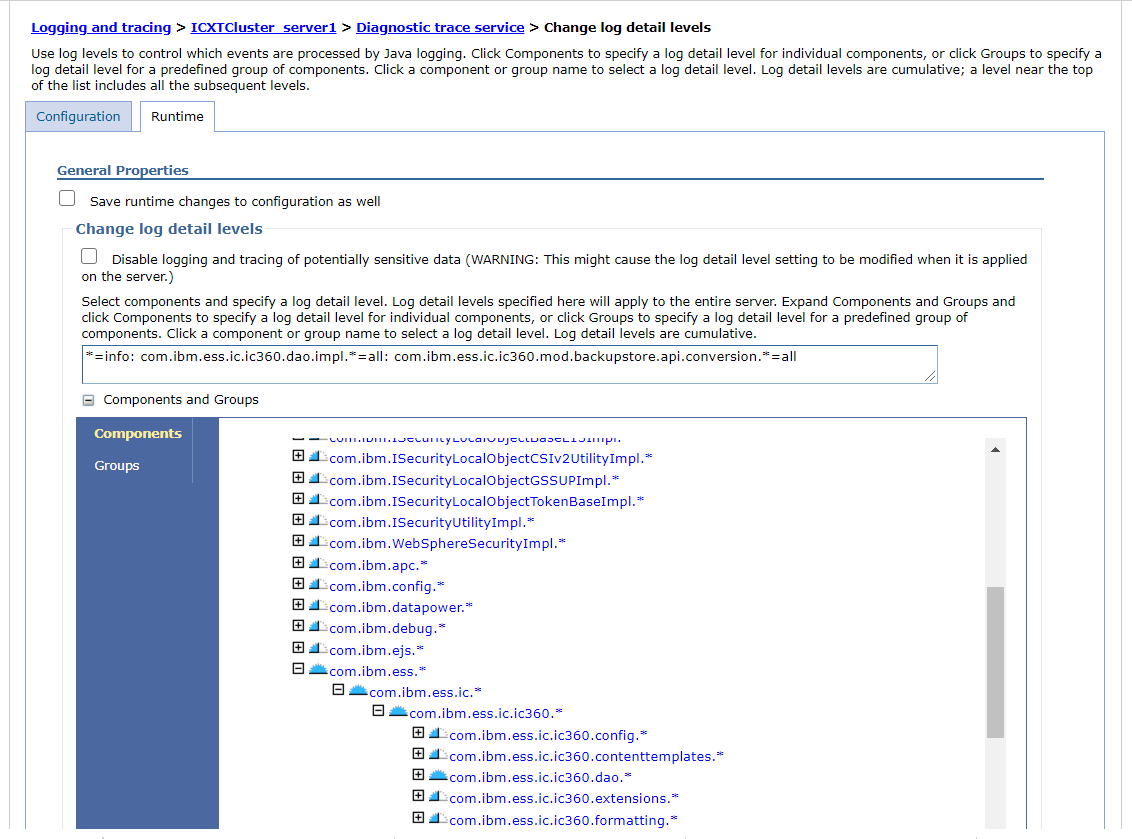
Trace logs can be enabled via WebSphere console via the following steps:
- Enter the WebSphere administrative console (e.g.: https://your.dmgr.host:9043/ibm/console) and navigate to Logging and tracing > ICXTCluster_server1 > Diagnostic trace service > Change log detail levels
- Select the server the IC360 applications are installed on
- Navigate to General Properties > Change log detail levels
- Navigate to Runtime tab to set traces for the running application.
- Add the traces mentioned above in the Change log details levels text input field or select the required traces from the Components and Groups list.
- Click Apply and OK to apply changes.
Note: If debugging during server/app initialization is necessary, check the checkbox to Save runtime changes to configuration as well in the General Properties section. This will keep trace settings enabled throughout a server restart. The logs need to actively be removed after debugging, whereas runtime traces will be cleaned up during next server restart.
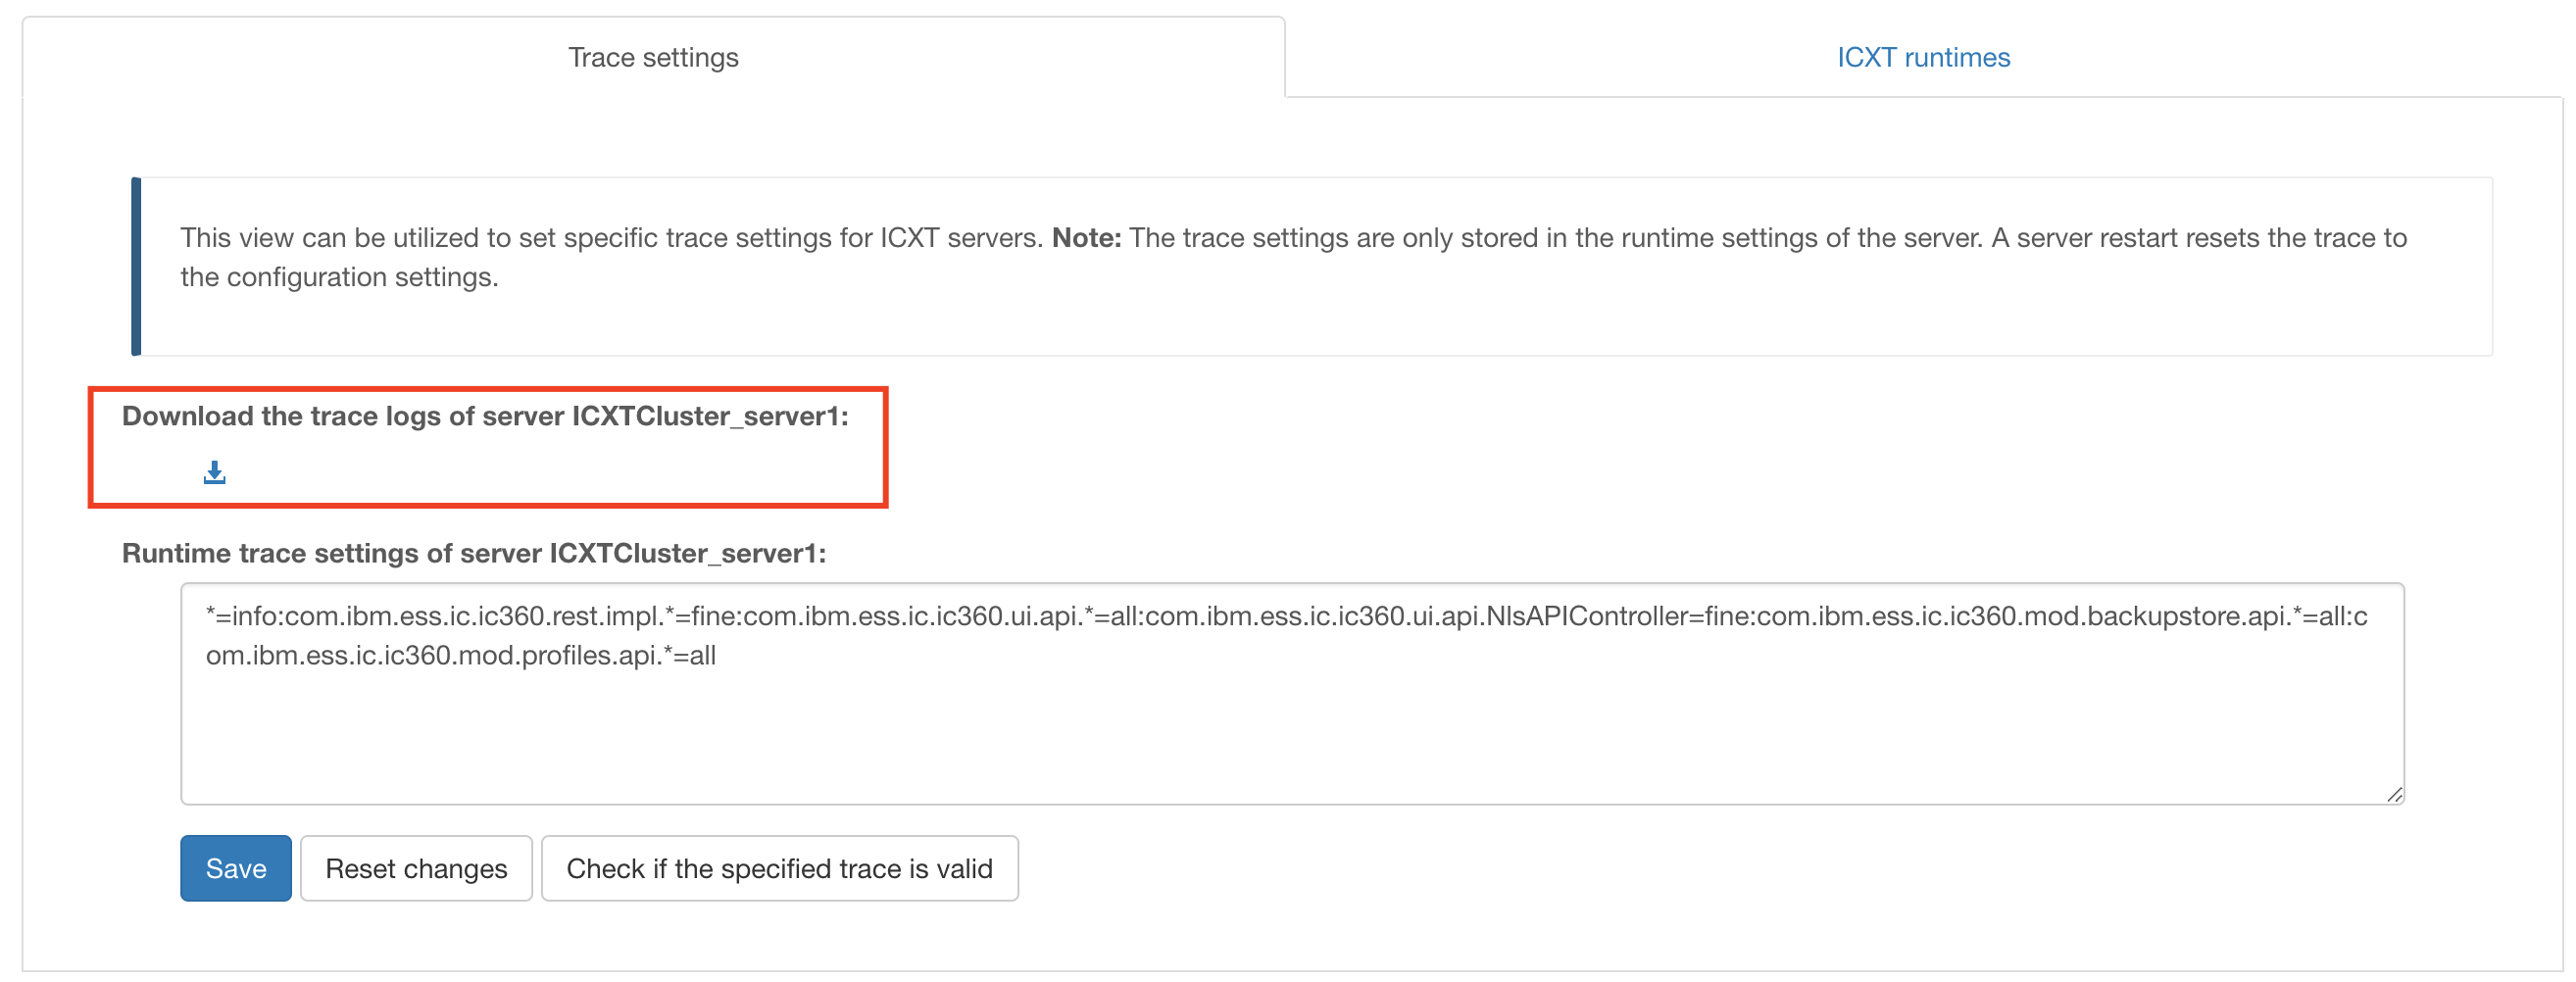
A trace.log file will then be generated in the server’s logfile directory. This can be found by navigating to APPSERVER_PROFILE/logs/ICXT_SERVERNAME/trace.log on the respective application server’s file system. * APPSERVER_PROFILE example path: /opt/IBM/WebSphere/AppServer/profiles/AppSrv01 * ICXT_SERVERNAME example name: server1, ICCluster_server1 or ICXTCluster_server1
Client-side
Following URL parameters can be used in order to enable client-side logging. This can be used in combination with the browser’s developer tools like the network activity inspector or javascript debugger.
jsdebug=true
This parameter activates the console logger.
jscomponents=componentA,componentB
This URL parameter allows to enable certain components. It is useful to trace-down an error within a certain component (directive or controller)
combined=false
This parameter deactivates the JS combination feature. If this parameter is set, all JS files will be served separately.
angulardebug=true
This parameter renders unminified angular files. If an angular error occurred this parameter could be used to get more accurate JS stack traces.
Report issues
If you experience an error or malicious behavior of ICXT, please report it to us. In order to ease error analysis, we need as much information as you can provide.
Following information are interesting:
- Describe the issue as detailed as possible. If it helps to understand it, attach a screenshot.
- Find log file on path APPSERVER_PROFILE/logs/ICXT_SERVERNAME/trace.log
ICXT Maintenance
The ICXT Maintenance page offers tools and features to manage and maintain your ICXT application. You can access the ICXT Maintenance page by navigating to Tools > ICXT Maintenance. The page includes the following features:
- Trace Settings
- ICXT Runtimes
Trace Settings
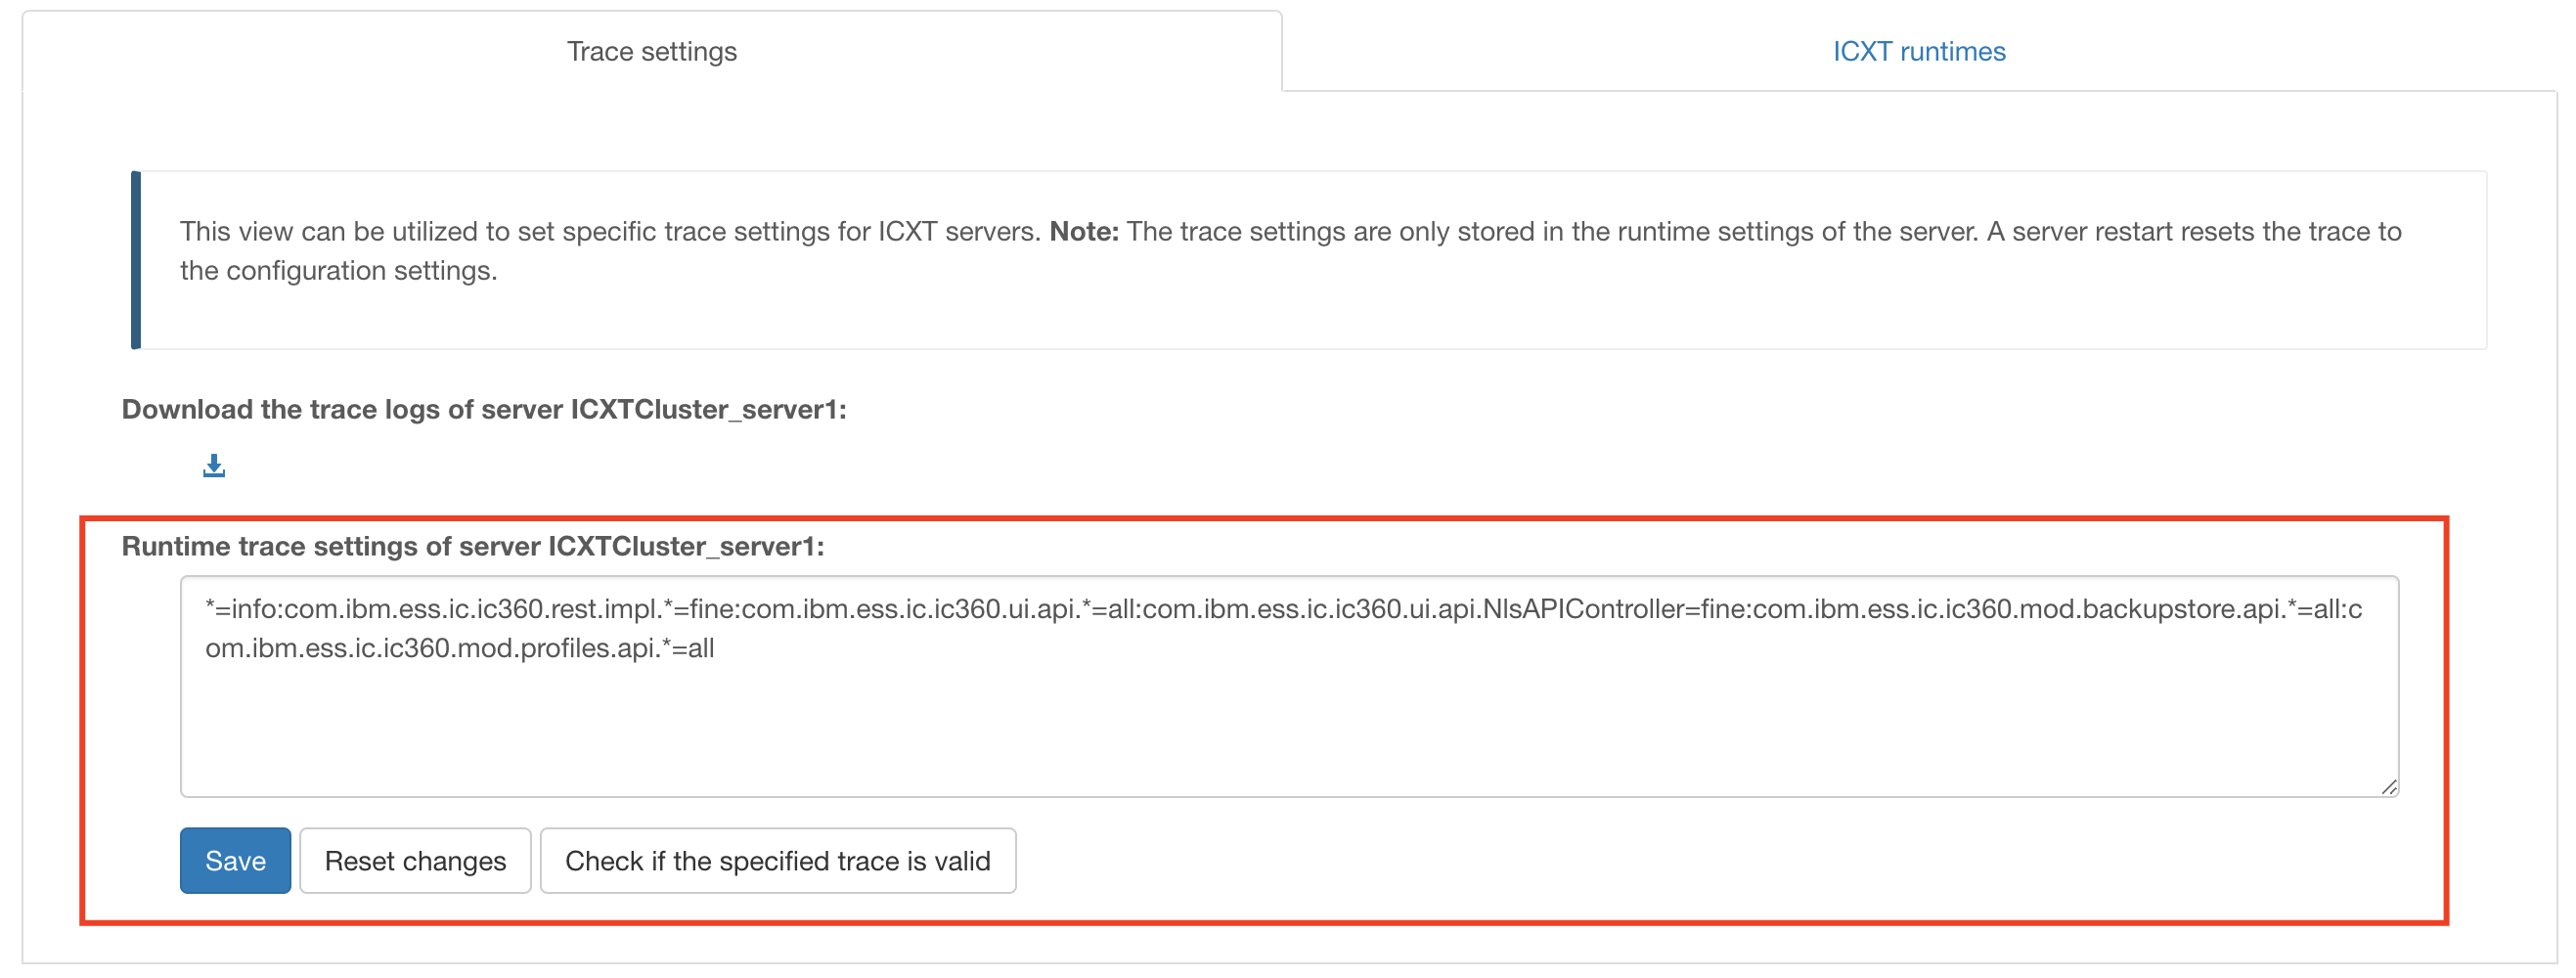
ICXT provides an admin user interface that allows you to adjust trace settings of the runtime configuration and download the most recent log files for the server.
Note: The trace settings are only stored in the runtime settings of the server. A server restart resets the trace to the configuration settings.
Apply Recommended Settings
You can provide your trace configuration or use the recommended one by clicking the Use the recommended trace button.
ICXT Runtimes
This view can be utilized to verify ICXT server states and update ICXT applications.
Note: Please verify if the server and application lists are complete. If not, use the DMGR console to restart ICXT JVMs or update ICXT applications.
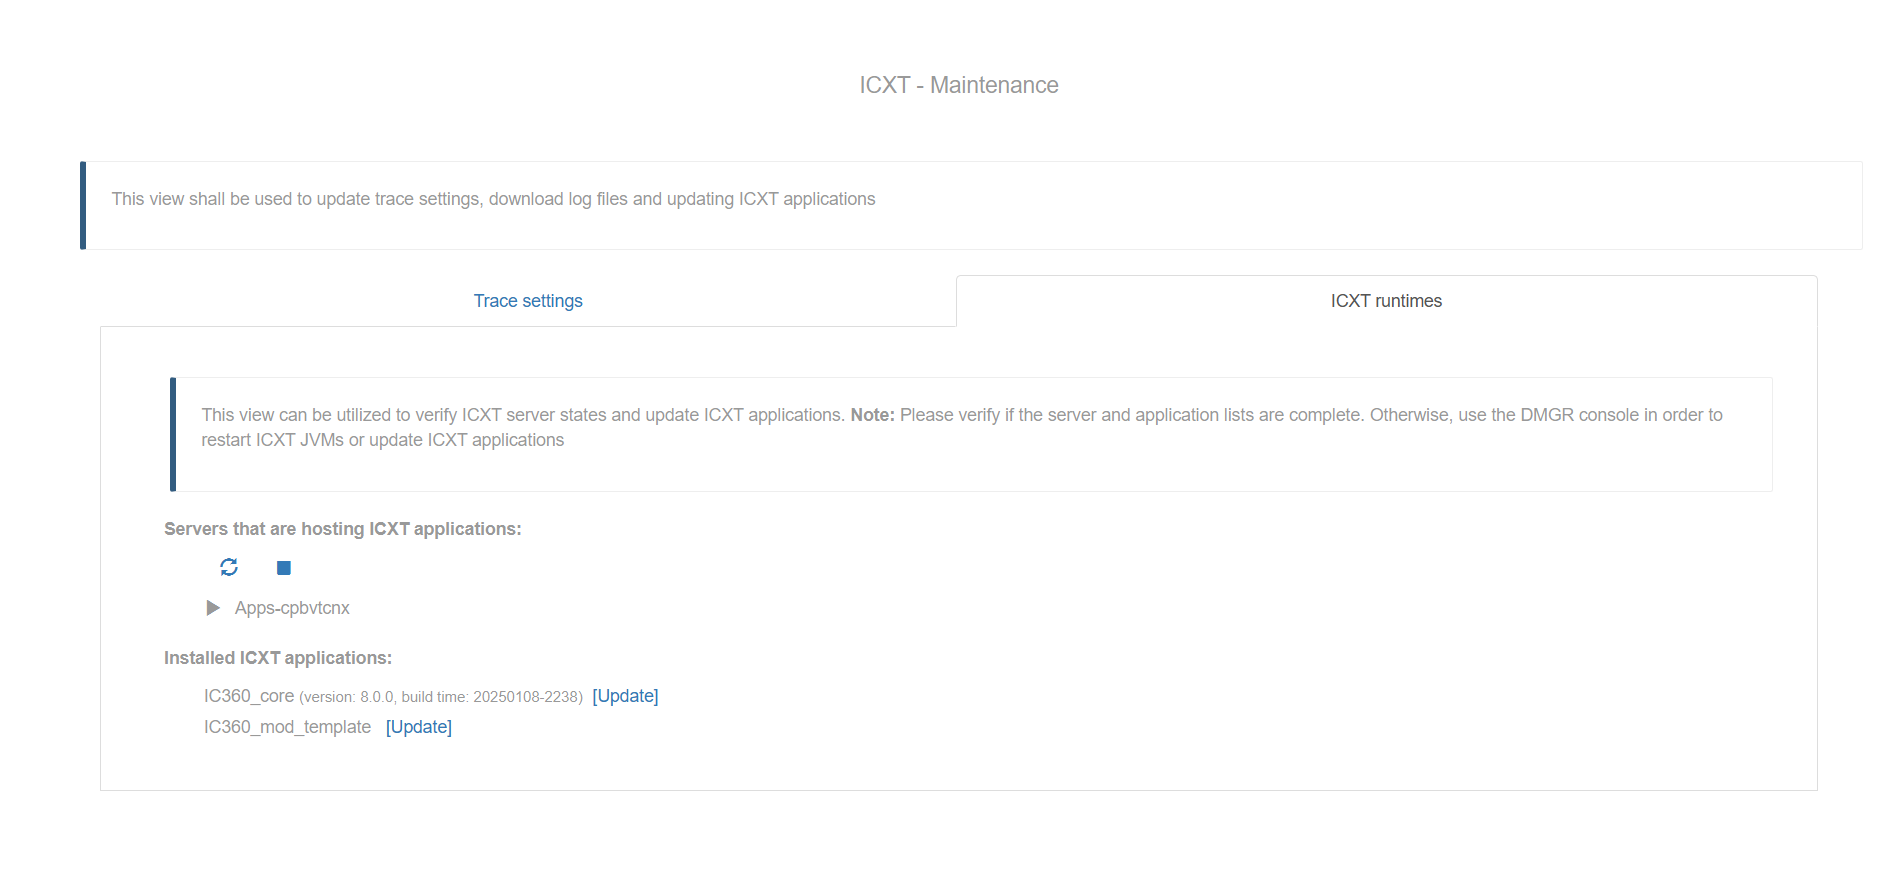
List ICXT Servers
Servers hosting ICXT applications are automatically listed when you access the ICXT Runtime tab. Each server’s name and status are displayed.
Get Server States
Click the Refresh Server States button to fetch the latest state of all servers. The states include “STARTED”, “STOPPED”, “RESTARTING”, and “UNKNOWN”.
Restart Running Servers
Click the Restart Running Servers button to restart all servers with the state “STARTED”.


