Report Overview
After applying filters, the Report Overview presents compliance insights through charts, summary tiles, and detailed data views.
About this task
Procedure
-
Chart section
The Chart Section provides a visual summary of the overall compliance status. The chart represents the percentage distribution of three key properties:
- Compliant: Devices that meet all compliance requirements.
- Non-Compliant: Devices that fail one or more compliance checks.
- Grace Period: Devices that are partially compliant or nearing non-compliance.
-
Summary Tiles
An exposure is defined as a single missing patch on an individual machine. For example, if one device is missing three patches counts as three exposures. Similarly, if three separate devices are each missing three patches, the total count would be nine exposures.
The page displays five interactive tiles that show aggregated and quantifiable compliance data:Note: Refreshing the Details Grid: The system now refreshes the Exposures Details Grid to display only the selected exposures when you click on one of the three compliance categories ("Compliant," "Not Compliant," or "Grace Period") within the summary chart.Table 1. Summary Tiles Tile Metric Total Exposures The total number of identified compliance exposures across all devices. Open Exposures Exposures that are still active or unresolved. Closed Exposures Exposures that have been successfully remediated. Total Fixlets The total count of fixlets considered in the report. Total Devices The total number of devices included in the compliance report. Figure 1. Summary Tiles 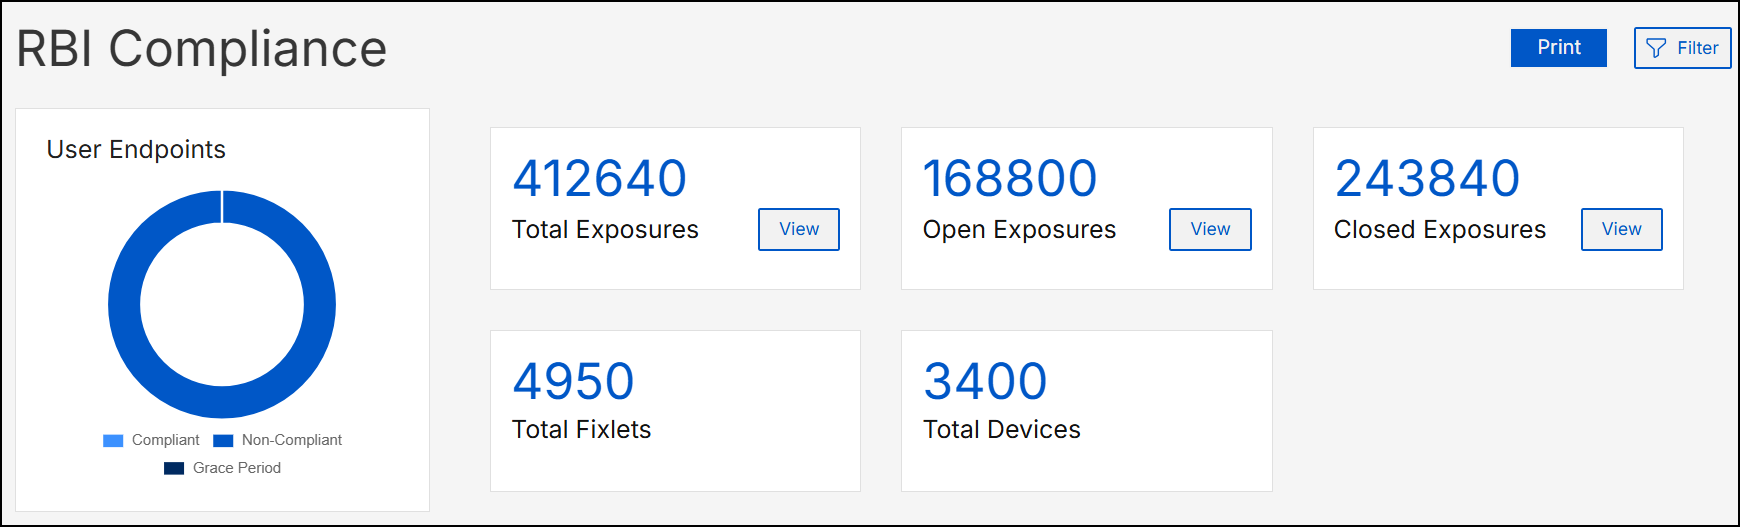
-
DataGrid View
The DataGrid presents the detailed report data and can be toggled between two views using the tabs in the top-right corner:
- Fixlet Tab:
- Lists Fixlet-level compliance data.
- Click any Fixlet to view associated devices.
Figure 2. Fixlets Tab 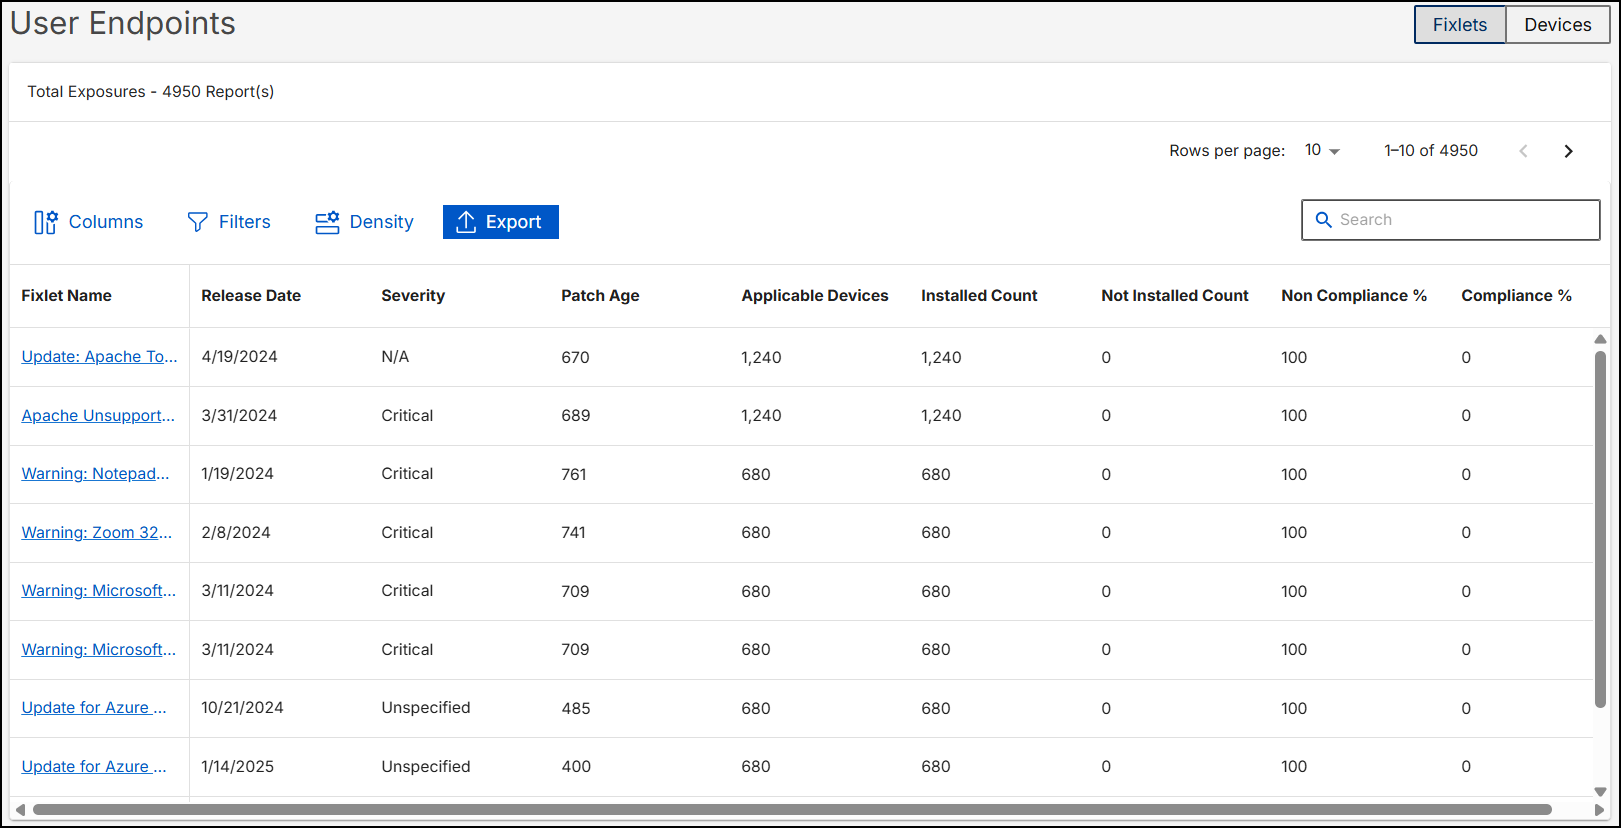
- Device Tab:
- Lists device-level compliance data.
- Click any Device to see its associated Fixlets.
Figure 3. Device Tab 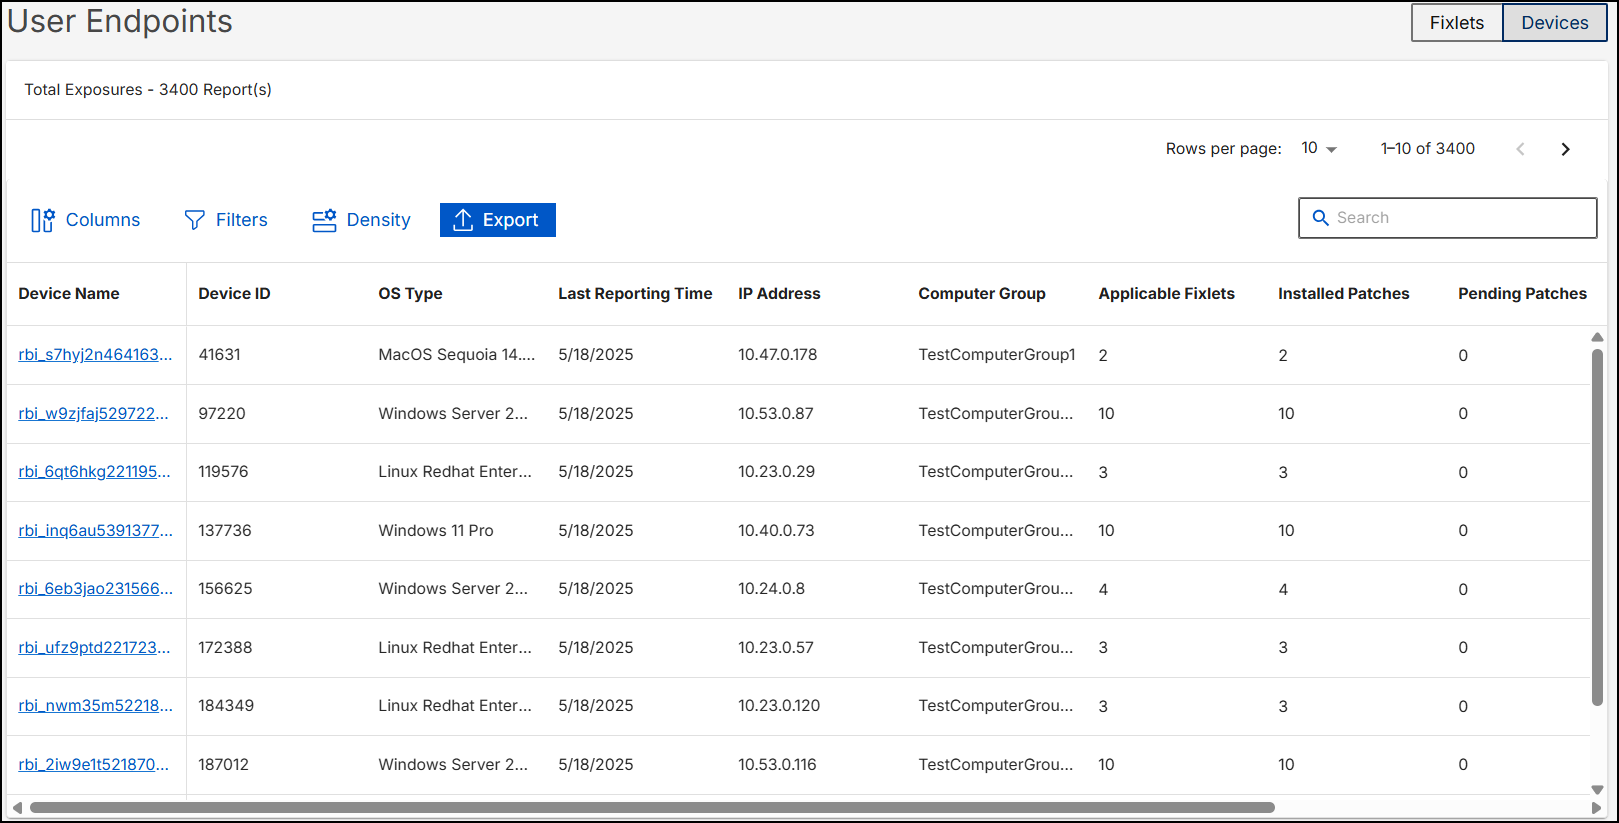
- Fixlet Tab:
-
DataGrid Controls
The DataGrid also provides several controls located above the table for enhanced analysis:
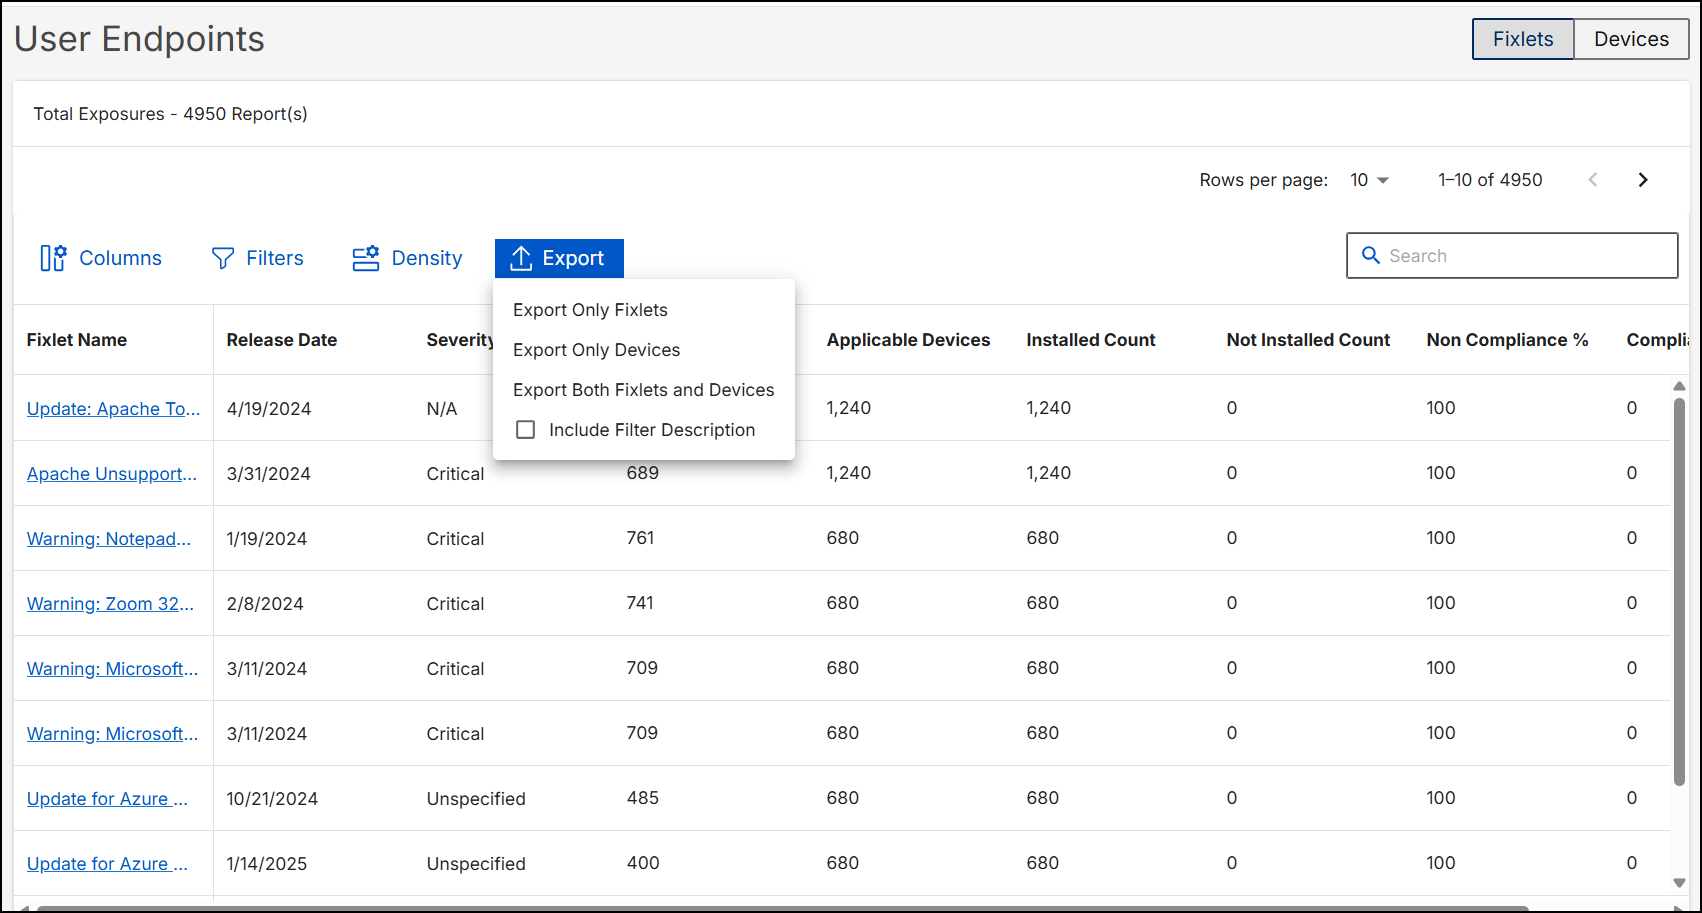
Table 2. DataGrid (After Applying Filters) Control Function Columns Allows you to show or hide specific data columns for customized visibility. Filters Enables the application of individual column-based filters to refine the displayed data. Density Adjusts the row height (Compact, Standard, or Comfortable) for viewing preference. Quick Search A search input to quickly locate specific records within the displayed data. Export Provides an Export to CSV option to download the current DataGrid data for offline analysis. The export interface allows you to: - Select Data Content:
- Choose to "Export only Fixlets," "Export only Devices," or "Export Both Fixlets and Devices."
- Include Filter Description:
- Toggle this option to include the active filter's parameters within the exported file for better context.
Figure 4. DataGrid Controls-Exports 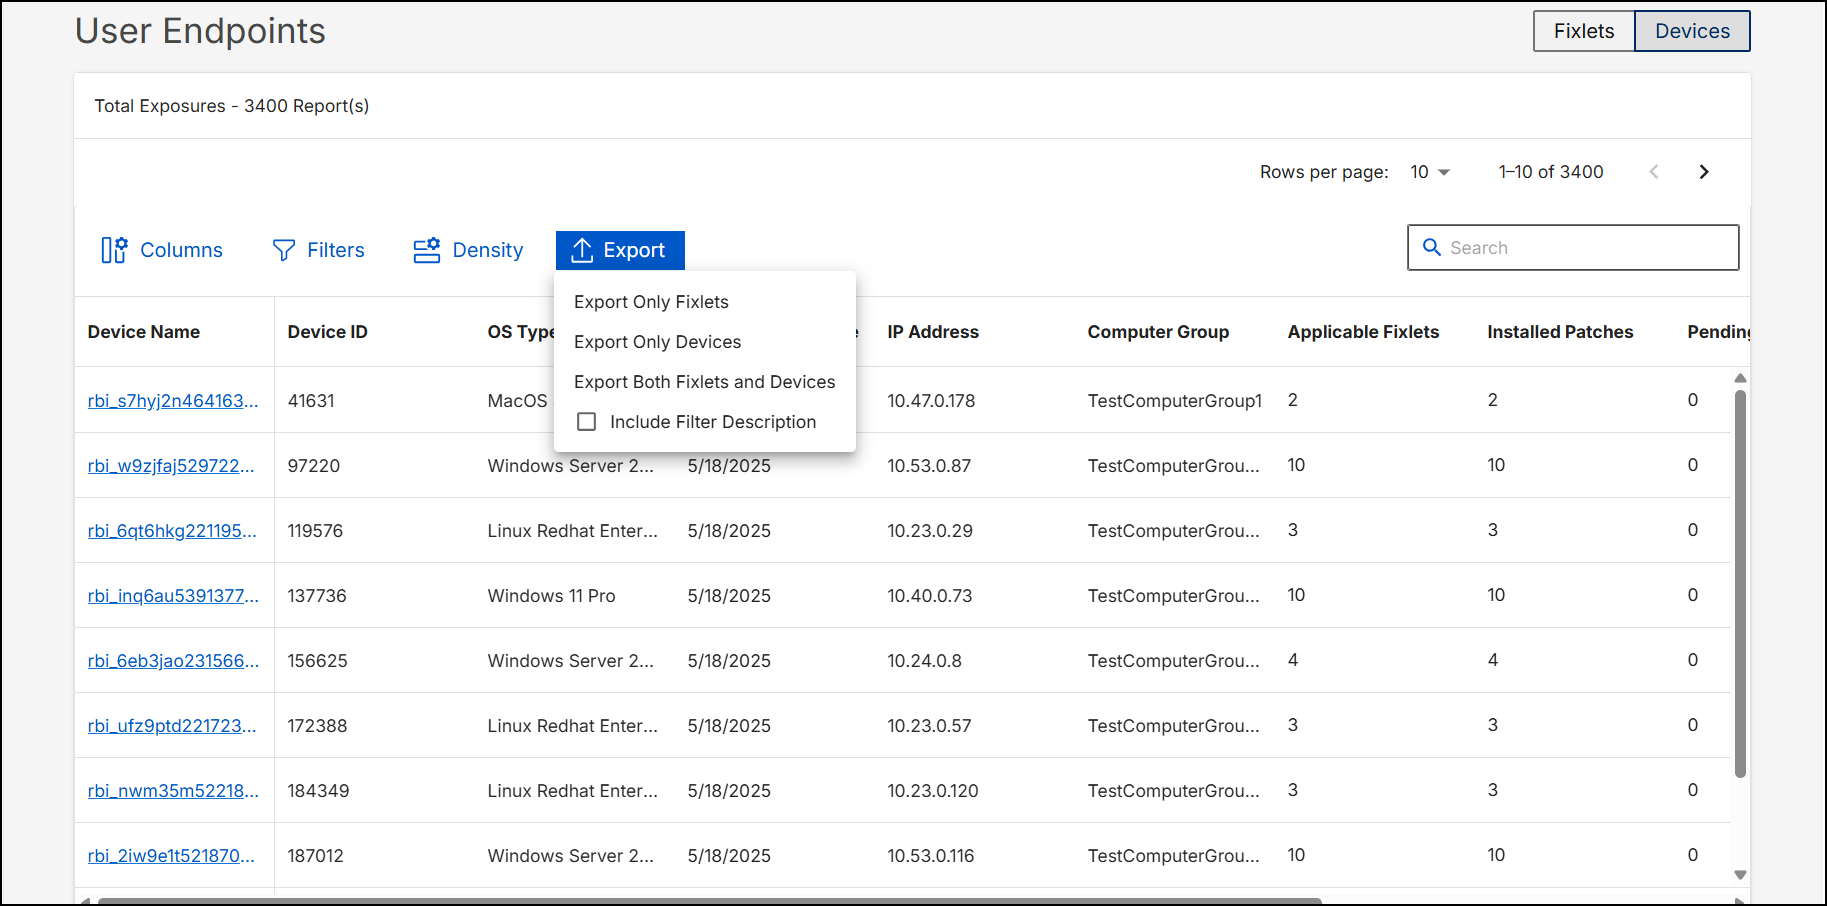
-
Detailed View
You can click on any Fixlet or Device name within the DataGrid to view individual details:
- When a Fixlet is opened: A popup window displays all associated devices relevant to that specific Fixlet.
Figure 5. Fixlet Details 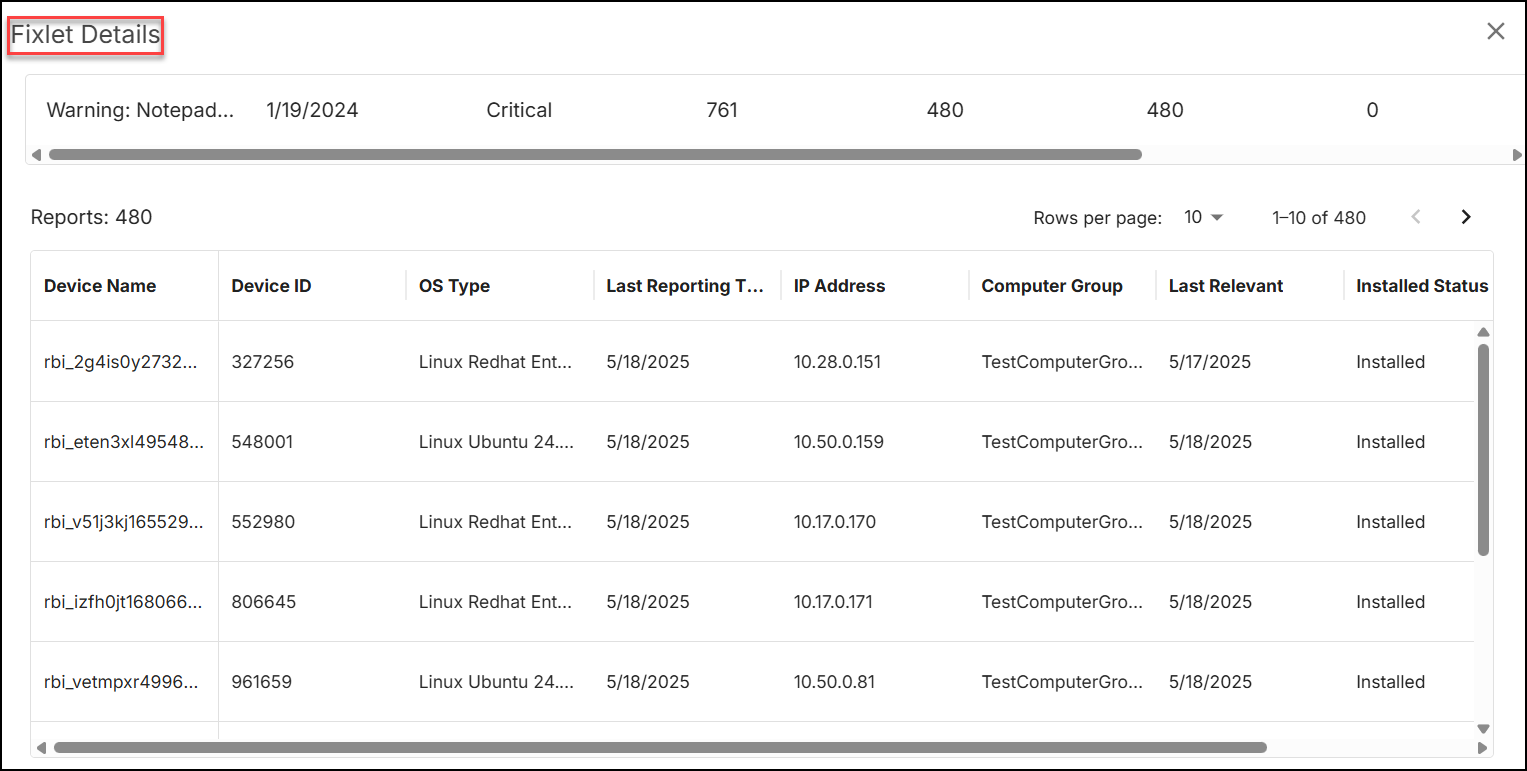
- When a Device is opened: A popup window shows all Fixlets linked to that specific device.
Figure 6. Device Details 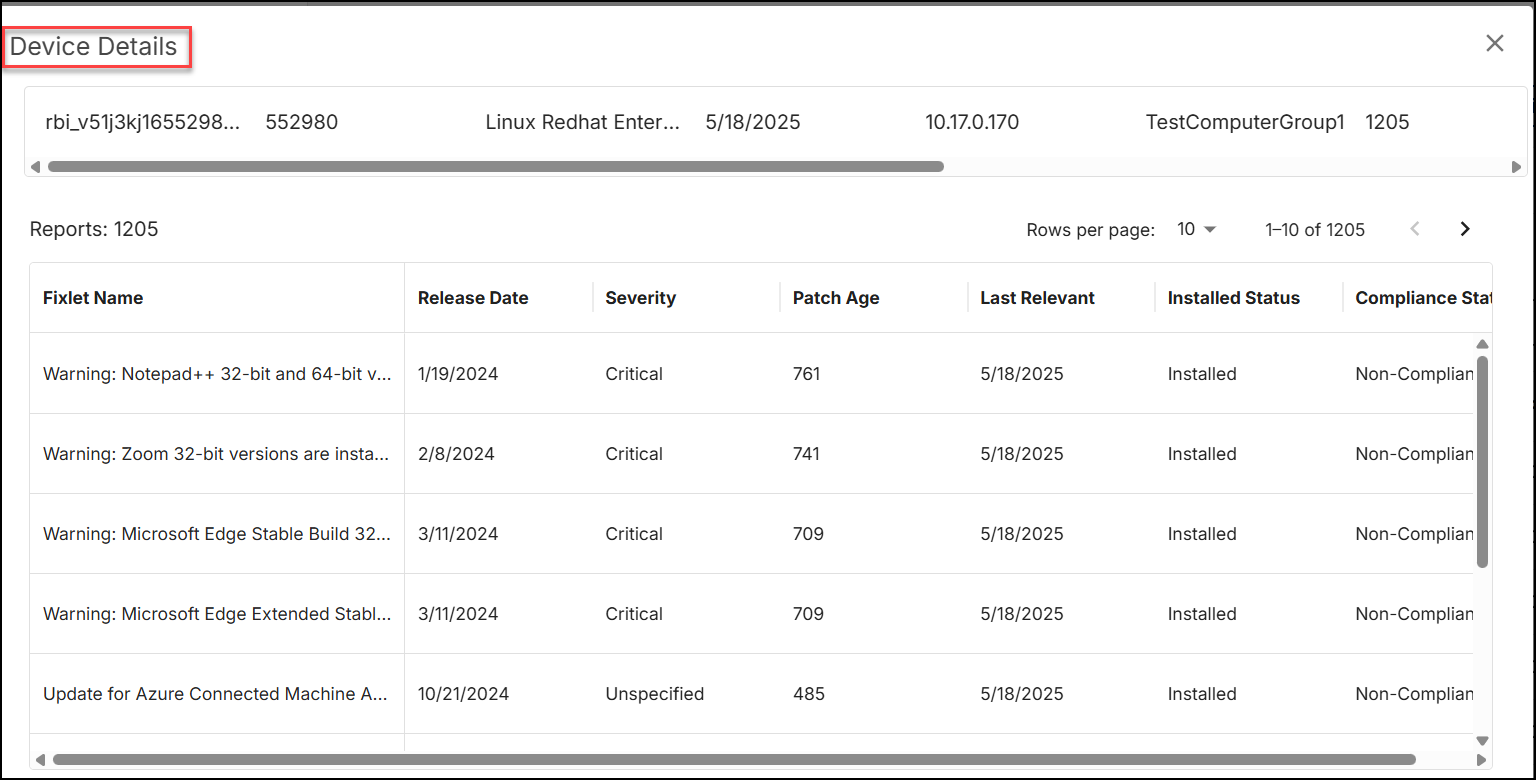
- Last Relevant Field:
The Last Relevant field records the final timestamp a Fixlet was detected as applicable to a device. While it is typically used to identify the Installation Date, it technically represents the moment a device transitioned to a "Not Relevant" state.
Key Interpretations:
- Standard Patching: In most cases, this is the Installed Date, marking when the patch was verified as present on the system.
- Cumulative Updates: When a modern cumulative update is installed, all previously related Fixlets will share the same Last Relevant date, as they are all resolved simultaneously.
- Supersedence: If a Fixlet is replaced by a newer version (and superseded evaluation is disabled), the date reflects when the Fixlet became obsolete, not when it was installed.
- Environmental Changes: If software is manually uninstalled or a setting is changed, this date tracks the state change rather than a successful deployment.
- When a Fixlet is opened: