Alert details
See detailed information about an alert definition, its status, and history.
Before you begin

- Alert Definition
- Alert Instances
- Last 12 months history
Alert Information
About this task
- Anomaly Source KPI
- The KPIs that generated the alert instance .
- Alert generation
- The status of the alert. It can be Active or Deactive.
- Anamoly type
- The type of data that is monitored by the KPI that may trigger the alert.
- Alert Trigger
- Set of conditions defining the alert.
Opened Alert Instances
About this task
The Alert Instances section contains a table with all the alert instances that have been generated. The table displays the following information:
- Metric
- The subdivision criteria of the alert instances. Depending on the KPI, it can be job status, star time/duration or queue.
- Trigger type
- Continuous or Total.
- Highest Severity
- The highest severity of all detected alerts of the alert instance. For details, see Basic concepts.
- First alert detection time
- Date and time of the initial alert generation and the creation of the corresponding instance.
- Latest alert detection time
- Date and time of the most recent alert generated to date.
- Total alerts
- Total number of alerts generated since the initial detection.
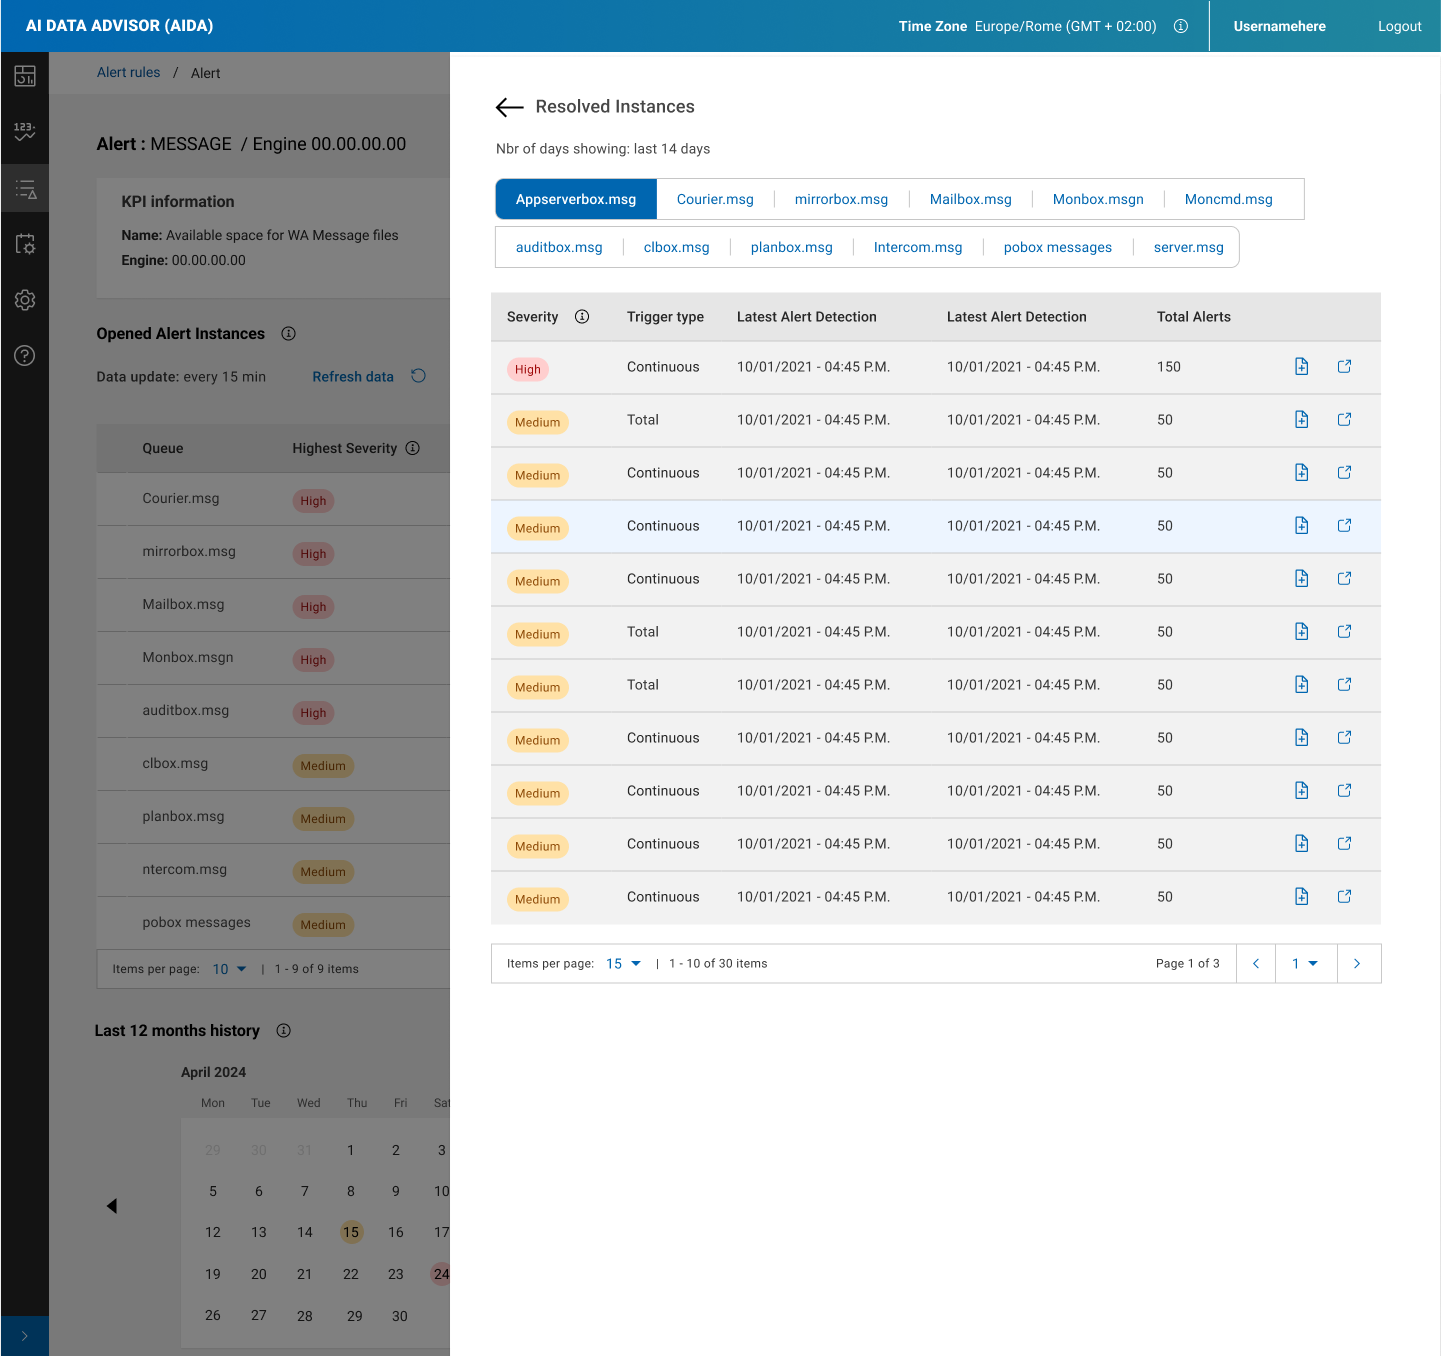
- Resolve: to resolve the instance.You can resolve all instances by clicking the button at the top of the table. To view only the resolved instances, click the See All Resolved Alerts button at the top of the table. This action will open a side panel displaying the resolved instances from the past 14 days in a tabular format. Additionally, you can filter the view by KPI metrics such as job status, queue, duration, or start time.Note: Alert instances in Open status are automatically marked as Resolved after a time period defined by the RESOLVE_ALERTS_AFTER_DAYS parameter configured for AIDA Exporter component (default value = 1 d) .
- Comment: you can add a comment about the alert instance and its resolution. Click Save to save your comments.
- Open instance page: to access the Instance detail page and run a detailed analysis. For details, see Analyzing an alert instance.
Last 12 months history
About this task
For each day affected by the alert, a colored circle represents the daily highest severity for the alert. On hovering over each day, you can also see the daily number of alert instances generated and, if present, the Special Day label.
Click Show more to see the following months.
Pause alert generation
About this task
When an alert status is Active, you can pause the alert generation with immediate effect by clicking the Pause button.
When the alert status is Paused, you can resume the alert with immediate effect by clicking the Resume button.