Overview dashboard
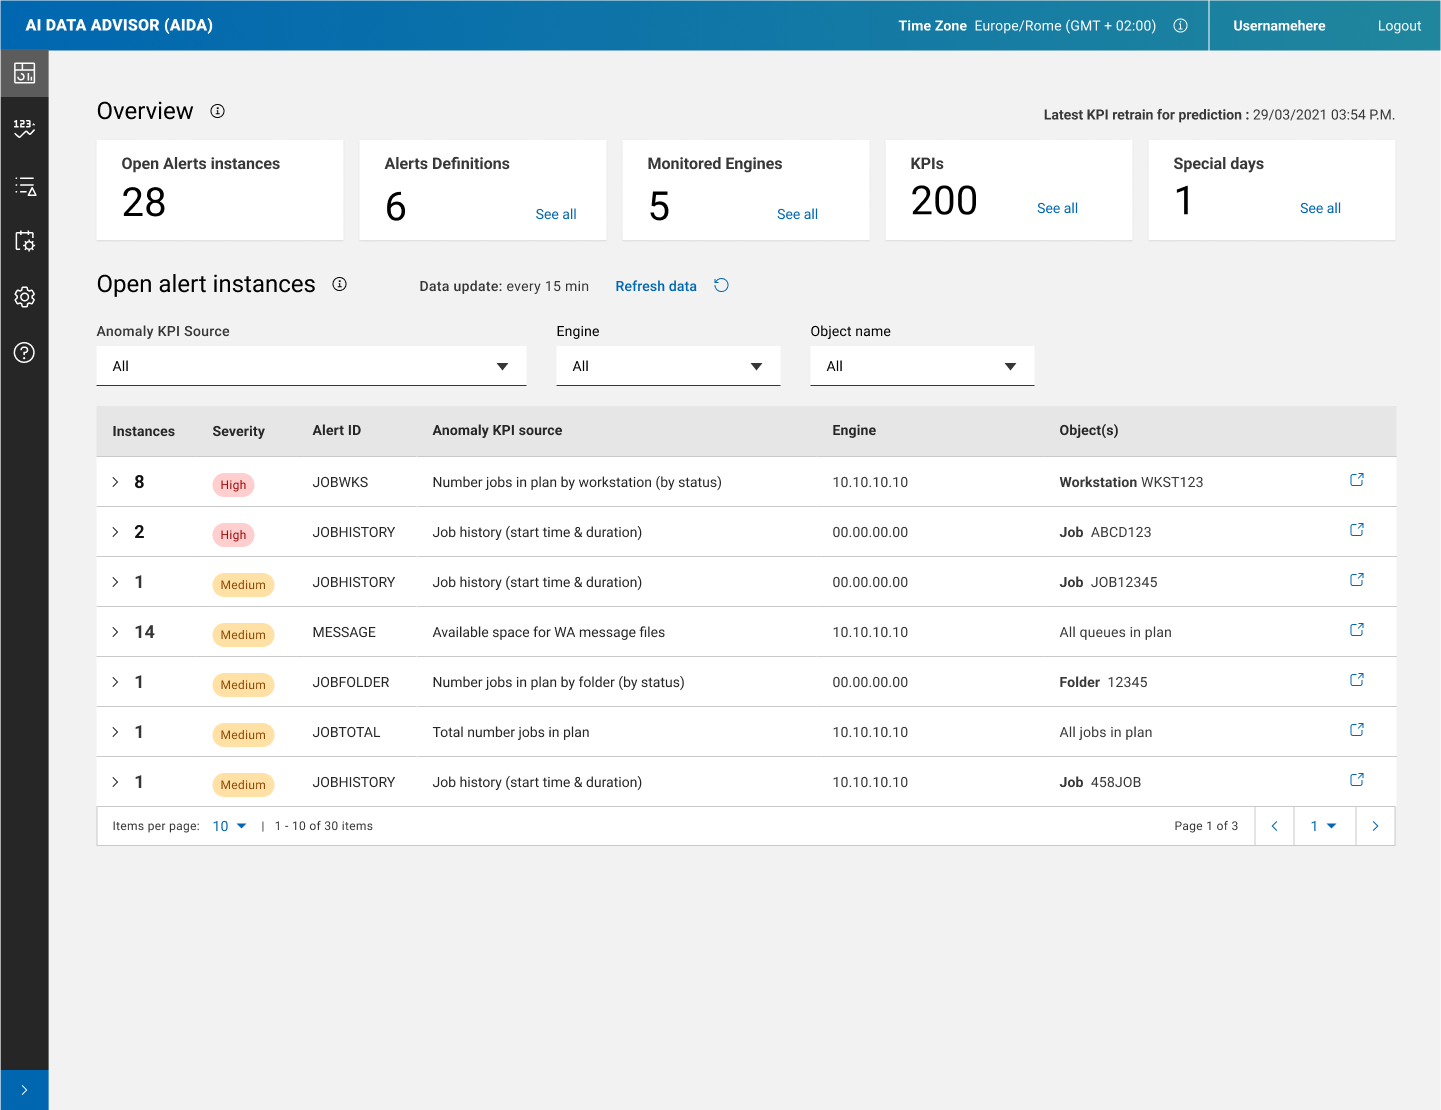
In the overview dashboard you can view the full list of alert instances.
About this task

- The number of alert instances in open status.
- The number of alerts defined in AIDA.
- The number of the monitored engines.
-
The number of the KPIs.
-
The number of Special days set.
The Open Alert Instances section contains a table with all the alert instances that have been generated. The instances have been grouped by alerts, an icon on the first column of each row allows to see the details of all the instances.
The data refreshes automatically every 15 minutes, you can also manually update it using the Refresh Data button .
- Instances
- The number of open instances for each alert.
- Severity
- The severity of the alert instance. Displays the highest severity for the alert.
- Alert ID
- The name of the Alert definition corresponding to the alert.
- Anomaly Source KPI
- The KPI that generated the alert instance.
- Engine
- The engine where the KPI runs.
- Objects
- The name of the object measured by the KPI.
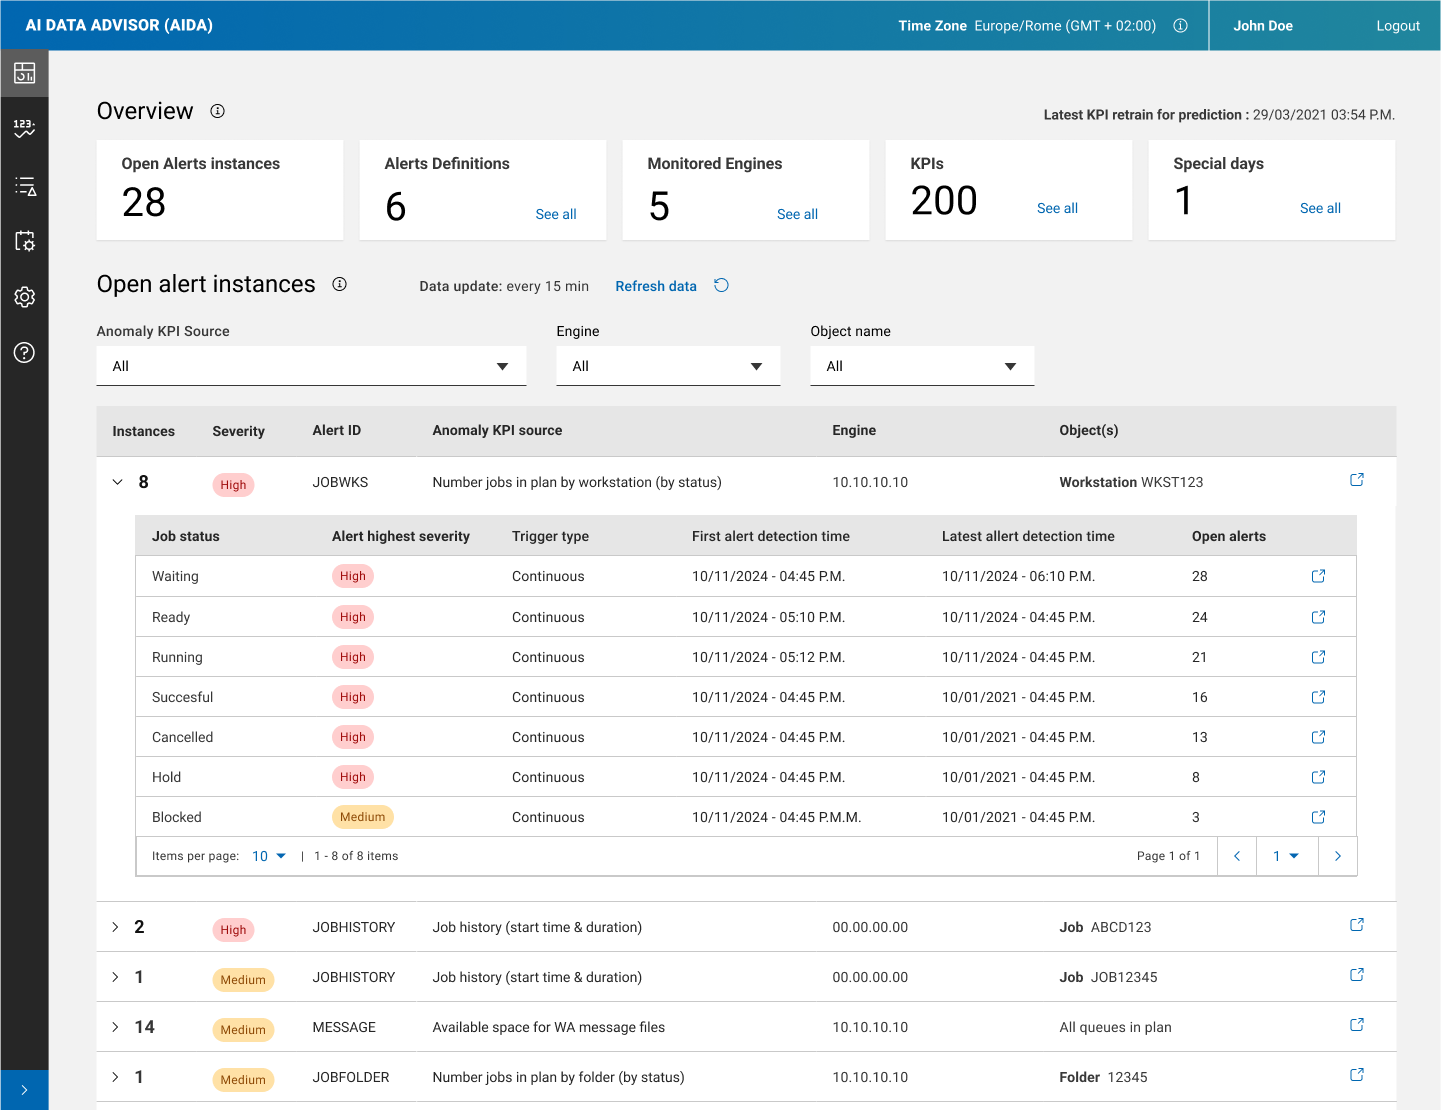
To view the instance details for each alert, click the icon in the first column. This will expand the row and display the instances in a table format. For details, see Alert detail page.

- Metric
- The subdivision criteria of the alert instances. Depending on the KPI, it can be job status, star time/duration or queue.
- Trigger type
- Continuous or Total.
- Highest Severity
- The highest severity of all detected alerts of the alert instance. For details, see Basic concepts.
- First alert detection time
- Date and time of the initial alert generation and the creation of the corresponding instance.
- Latest alert detection time
- Date and time of the most recent alert generated to date.
- Total alerts
- Total number of alerts generated since the initial detection.
To run a detailed analysis on an alert instance, click the open icon in the last column. For details, see Analyzing an alert instance.