Tracking an Event
To better understand the steps for tracking an event, let us track an event with the following objective: to encourage customers whose subscribe recharge amount is more than or equal to $100 in the last month.
Overview
Click events in the left navigation bar and select the event to track from the list of running events presented.
Once an event is selected, two tabs are shown, as seen in the image below. The View tab shows a summary of the audience, trigger, event and details. The Report tab allows tracking the responses of customers. Click the Report tab.
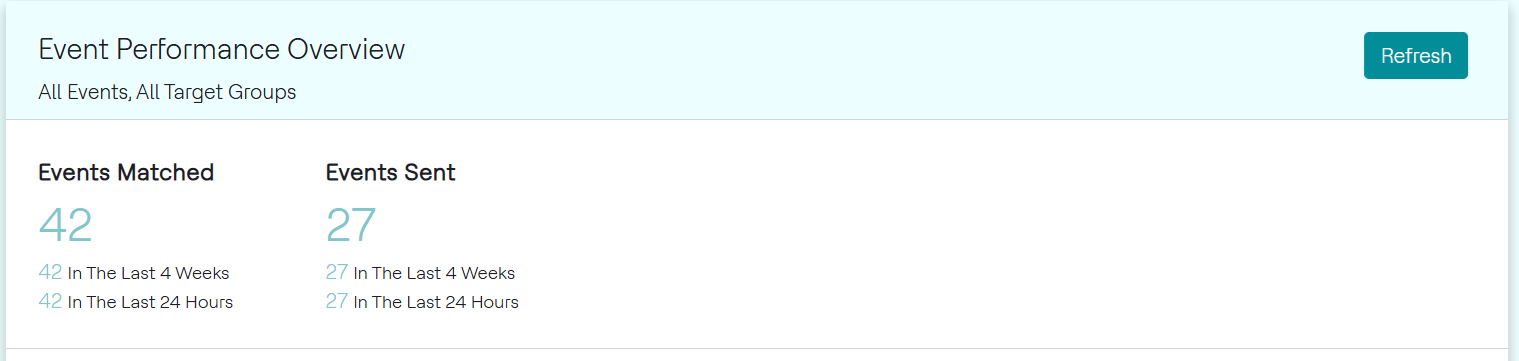
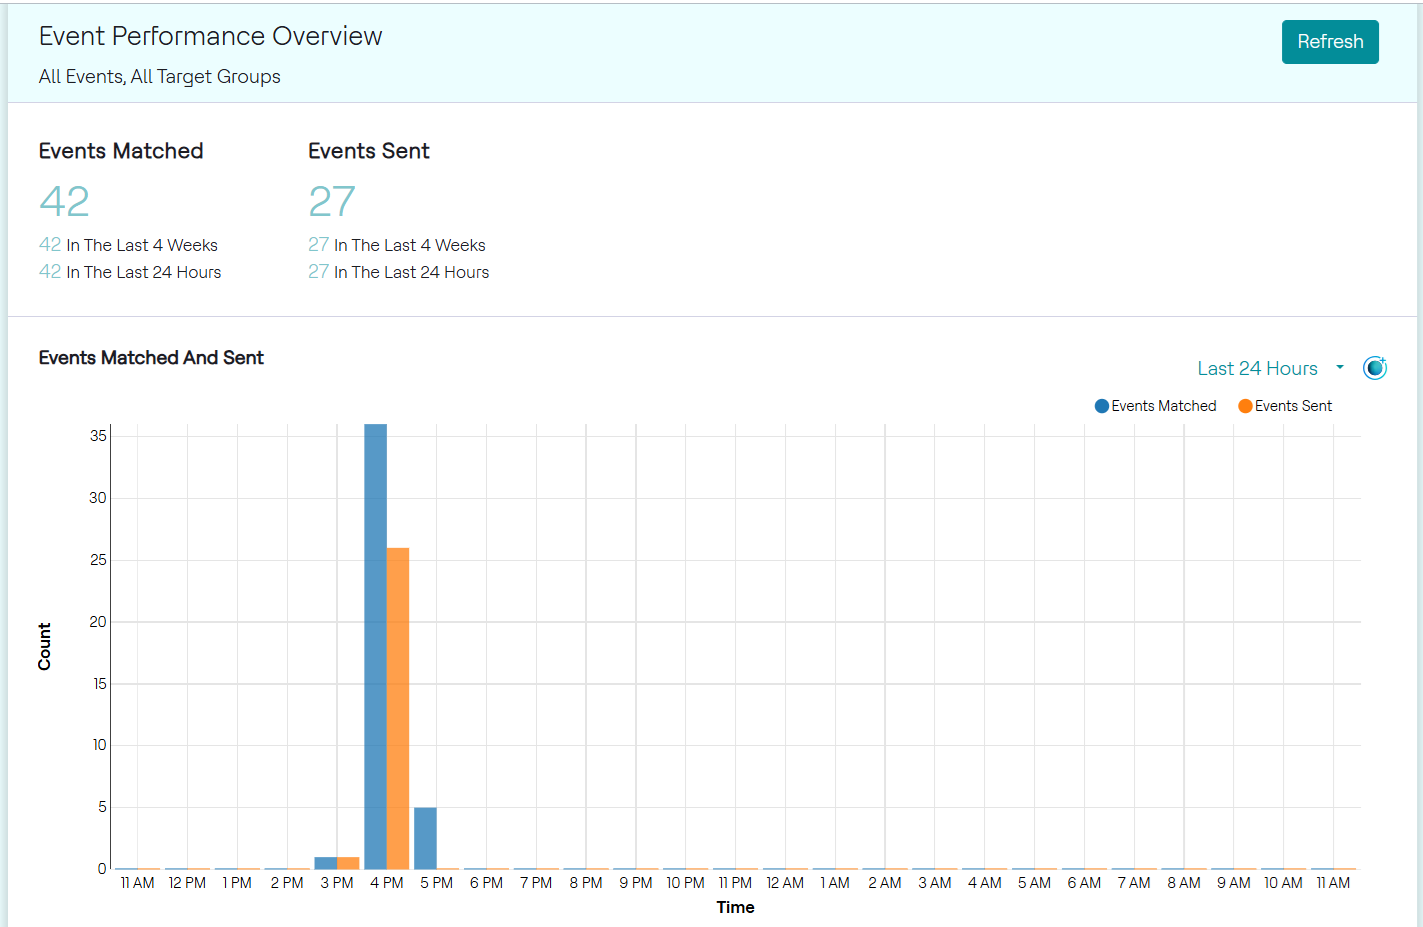
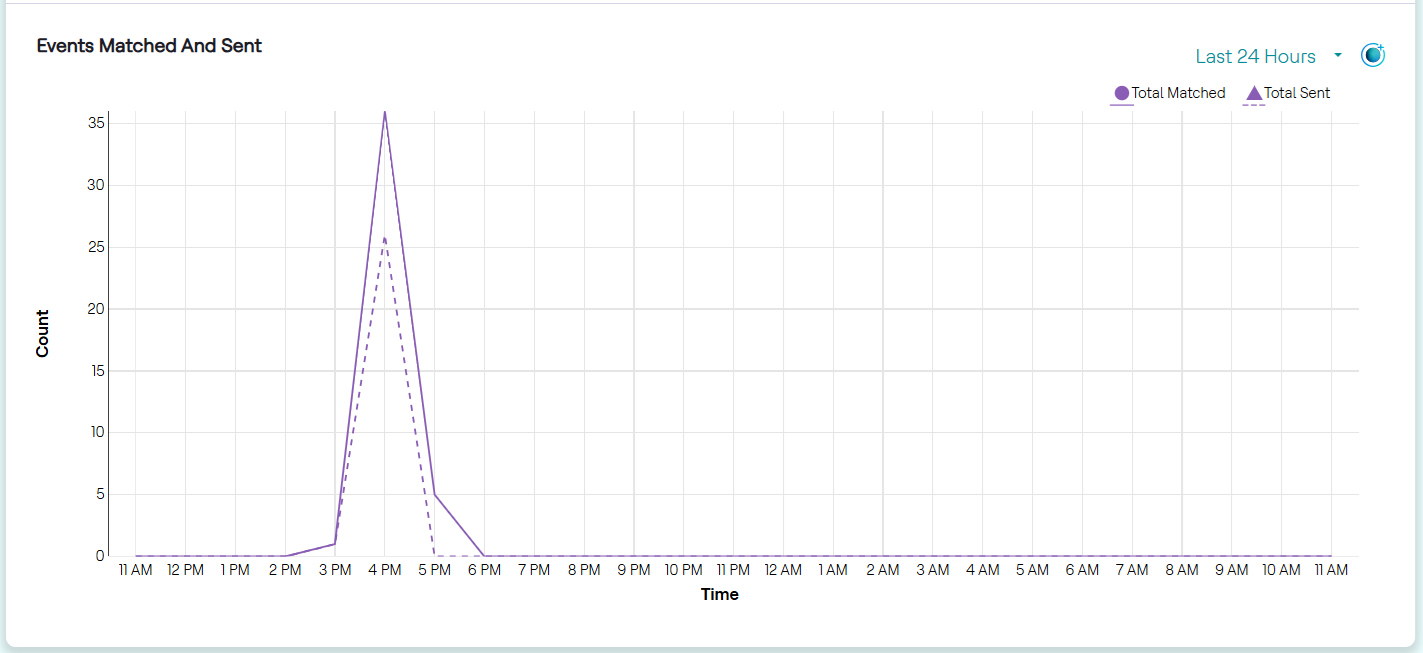
On the Report tab, the Event Performance Overview section displays data about the Events Matched, Events Sent, Events Redeemed, Response Rate and Average Response Time. A bar chart visualizing this data is also shown, as seen in the image below.
![]()
Click the MaxAI Insights icon. This feature provides an AI-generated analysis of the chart, helping you quickly identify significant patterns and anomalies in the data. For detailed summary of the chart, click Continue to Chat, and in the MaxAI chat window, click View detailed Insights to view the detailed summary of the chart.
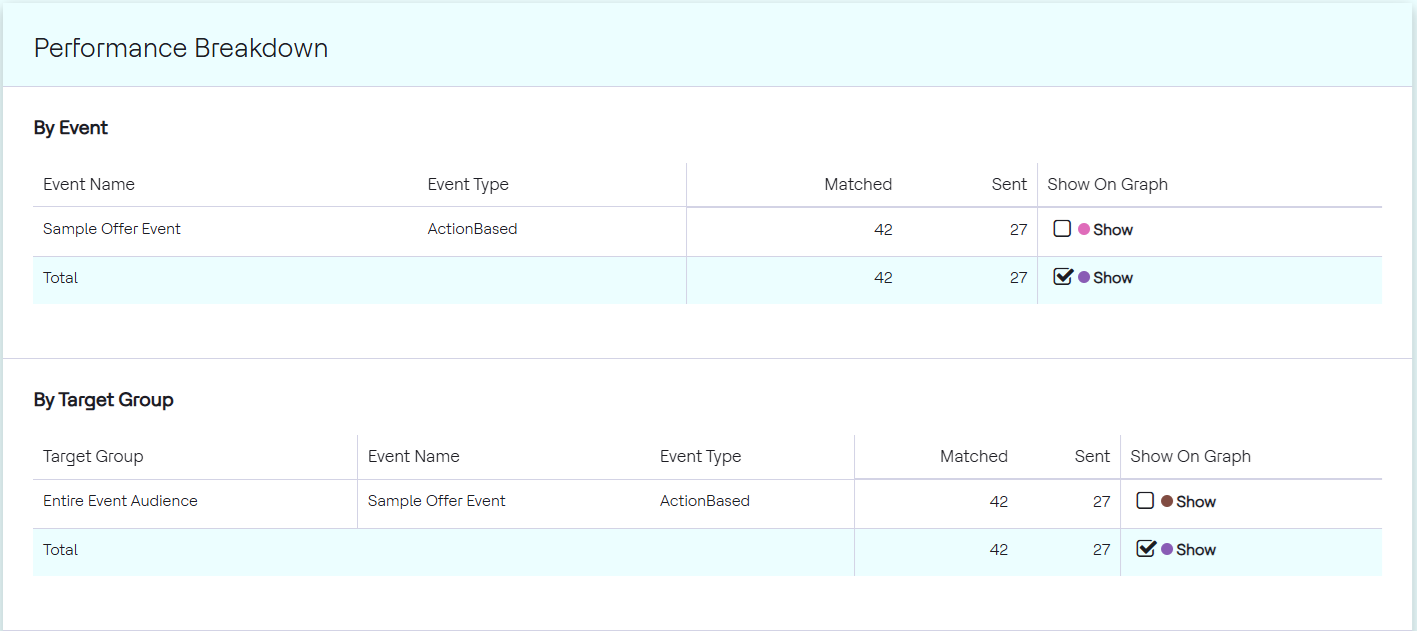
Performance Breakdown allows the user to track the performance of each event as well as the performance of each target group, as seen in the image below.
Details
Event Performance Overview
Events Matched refers to the number of customers that qualified to receive the event. For this sample event, the number is 16.
Events Redeemed refers to the number of customers that have redeemed the event and are given a product. For this sample event, the number is 73. Since the event for this event is an Action-Based event, these are the number of customers who have done the action. For Message-Only events, the Events Redeemed will be 0.
Response Rate refers to the Events Redeemed divided by the Events Sent. Average Response Time refers to the average amount of time it takes for customers to redeem the event. Both are in reference to Action-based Events.
Performance Breakdown
Performance breakdown By Event shows the performance of each event. Each Event name and Event type is shown, along with its Events Matched, Events Redeemed as shown above. In this sample event, New Event 1 is the only event given.
Performance breakdown By Target Group shows the performance of each target group. Each target group is shown along with the Event name, Event Type, Events Matched, Events Redeemed, for each one. In this sample event, there is no target group, so data on the entire event audience is shown.
Charts on Report
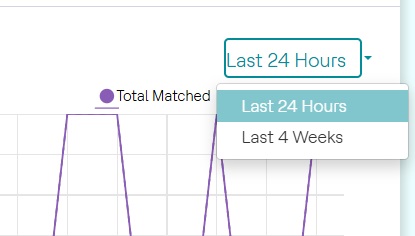
For charts shown on the Report tab, the time window displayed on the chart can be changed, as seen in the image below. More details about a point on the chart are displayed by hovering the mouse over it as seen in the last image.
Click the MaxAI Insights icon. This feature provides an AI-generated analysis of the chart, helping you quickly identify significant patterns and anomalies in the data.