Dashboard Overview
This page shows performance metrics and trends for live events, helping users monitor engagement outcomes in real time.
The Dashboard Overview page provides a snapshot of how events are performing in terms of customer engagement and redemption. You can view number of card transaction made over a selected time range. This dashboard helps you track real-time effectiveness and make decisions for optimization.
Chart and Metrics
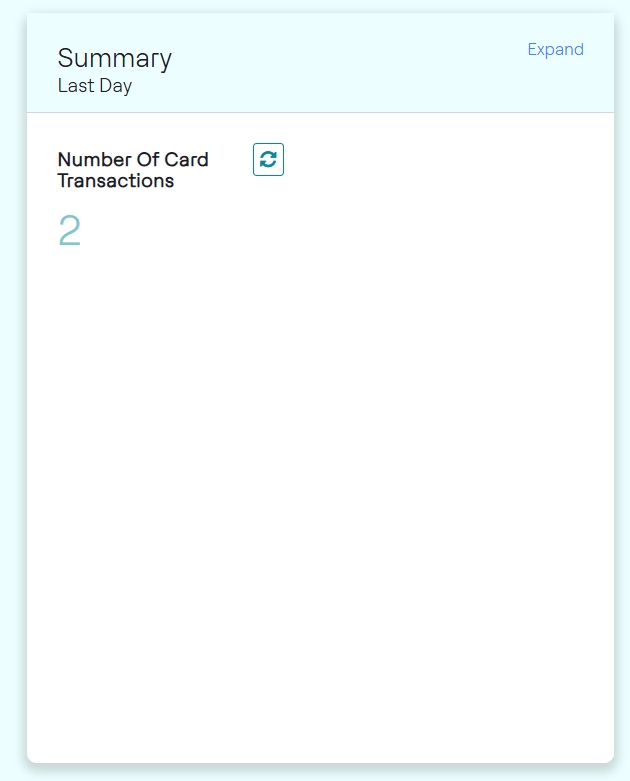
Event Summary
Event summary shows the number of card transactions made in the last day.
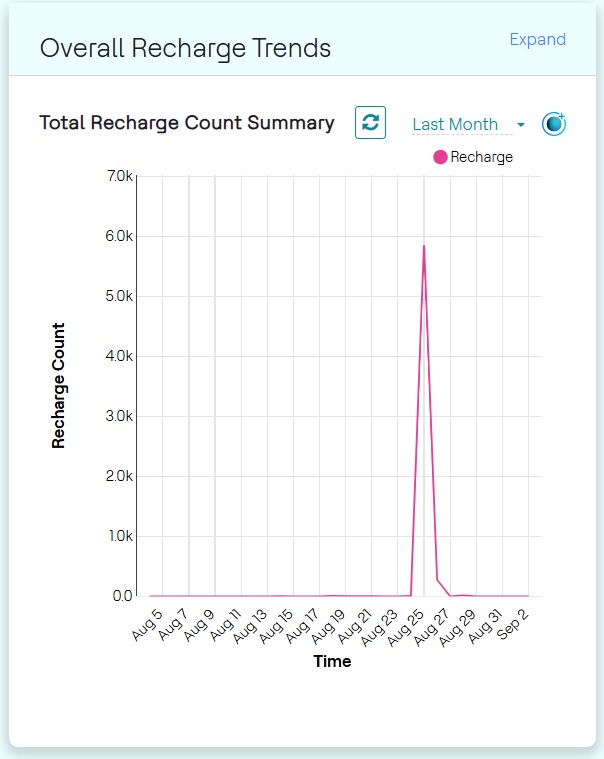
Overall Transaction Trends
This chart shows trends over a selected time range (e.g., Last Day, Last Week, Last Month). Hovering over data points reveals detailed counts at specific times. Use filters and date selectors to adjust the chart view.
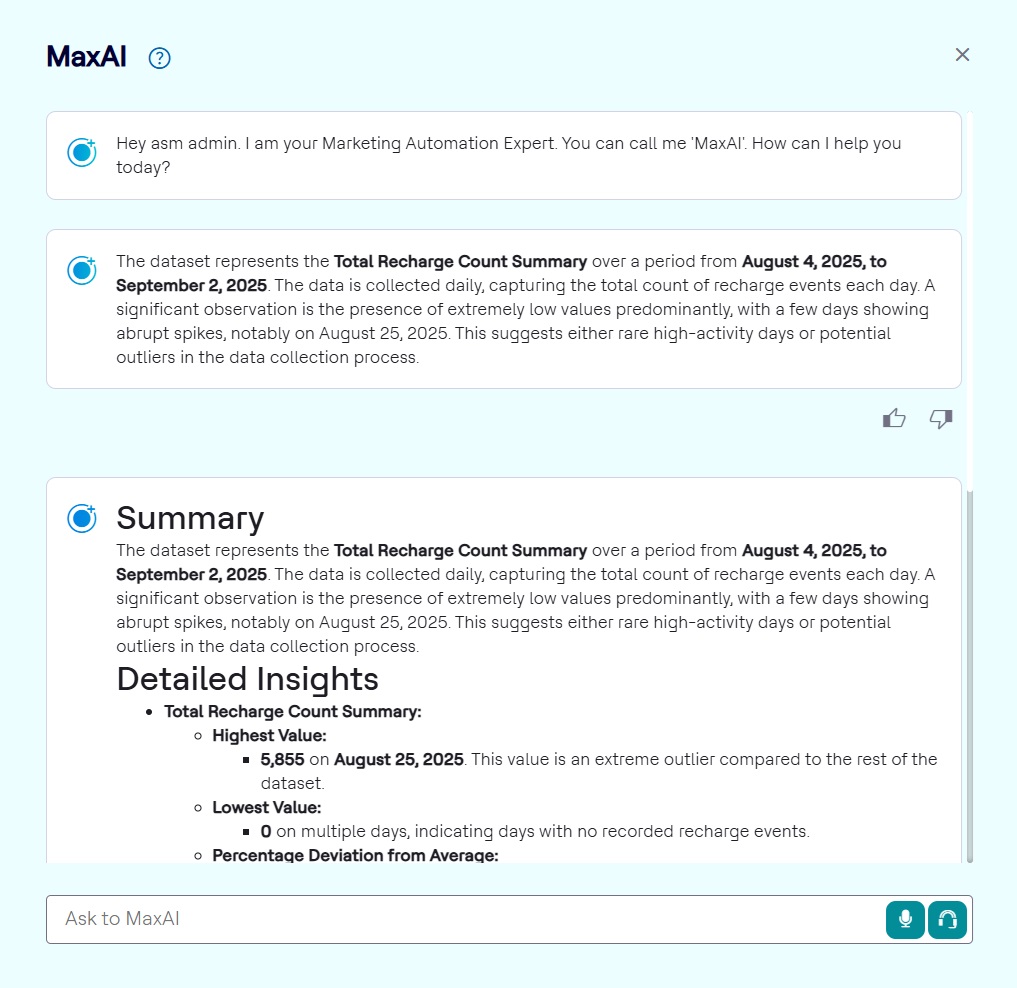
MaxAI Insights
- Click the MaxAI Insights (✨) icon. This feature provides an
AI-generated analysis of the chart, helping you quickly identify significant
patterns and anomalies in the data as shown below.
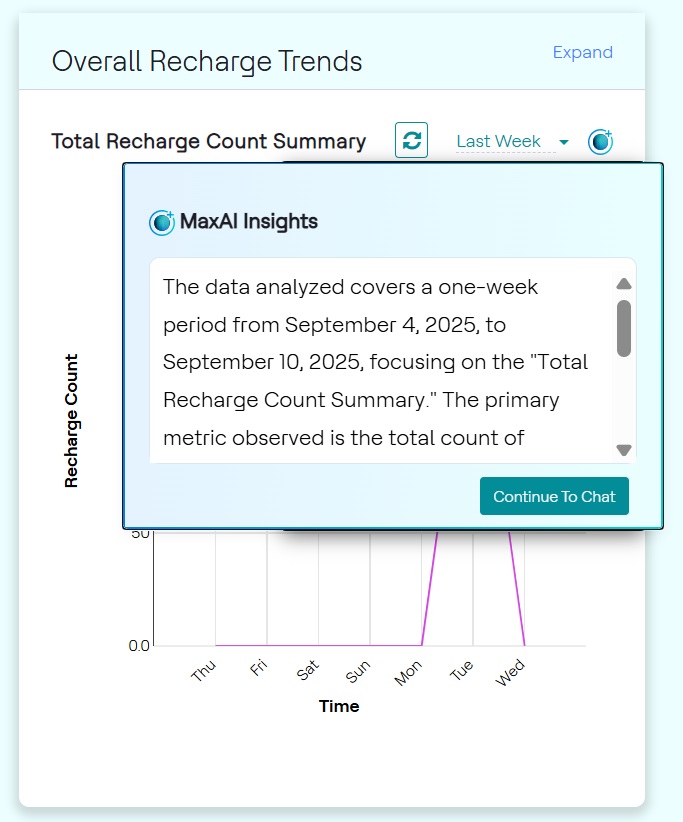 Note: You must have a MaxAI license to access MaxAI insights.
 - Click Continue to Chat. As a result, the MaxAI chat window displays
the welcome message followed by insights summary. Click View detailed
Insights in the Chat window to view the detailed summary of the
chart as shown below.