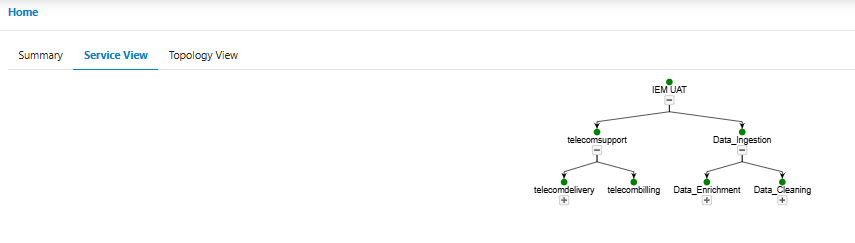
Service dashboards visualize the Service relationship data in a way that can be understood
easily. Service View shows the service tree for a customer. Parent and Child nodes are
depicted in the Services chart for a customer configured. The color coding shows the Service
Impact. Figure 1. Service View