Viewing Tenants’ Bill
In this section, the provider can see what they are charging the tenant and what is being charged by HCL to them.
- Go to Impersonate and click on the ‘Super Admin’ to proceed.
Figure 1. Impersonate 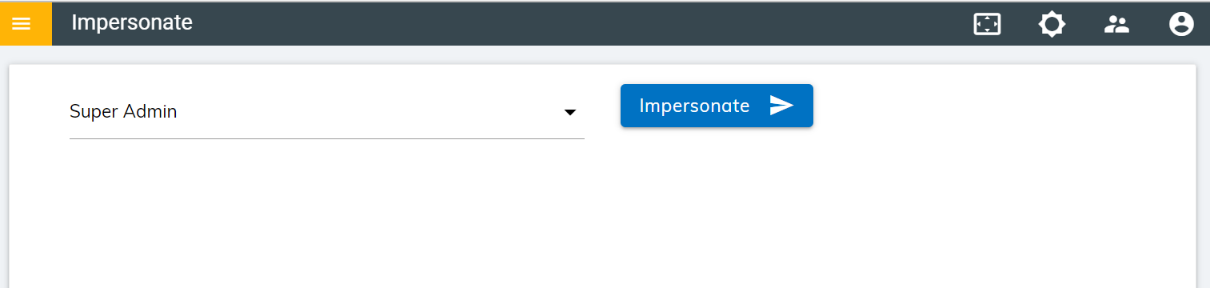
- The Billing Charges are displayed in the figure below.
Figure 2. Billing Charges 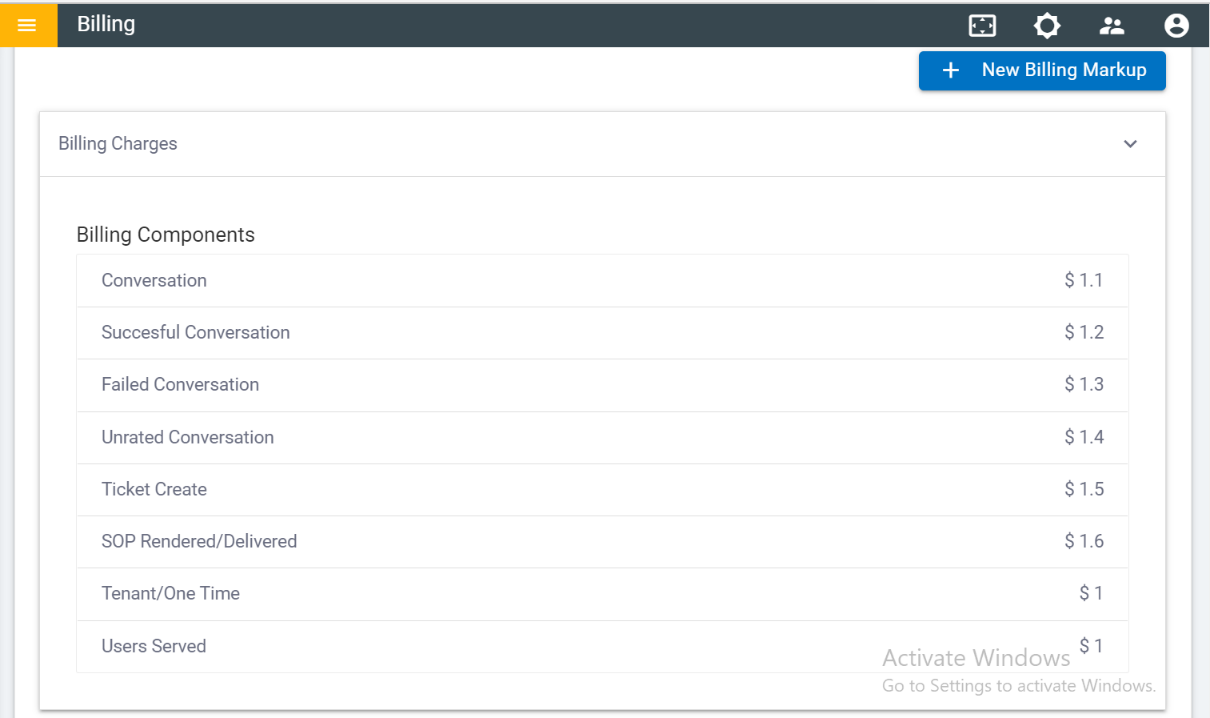
- To view tenant billing,
- On the Tenants screen, click
 icon as shown in Configuring Tenants.
It redirects you to the Tenant Billing dashboard.
Figure 3. enant Billing Dashboard 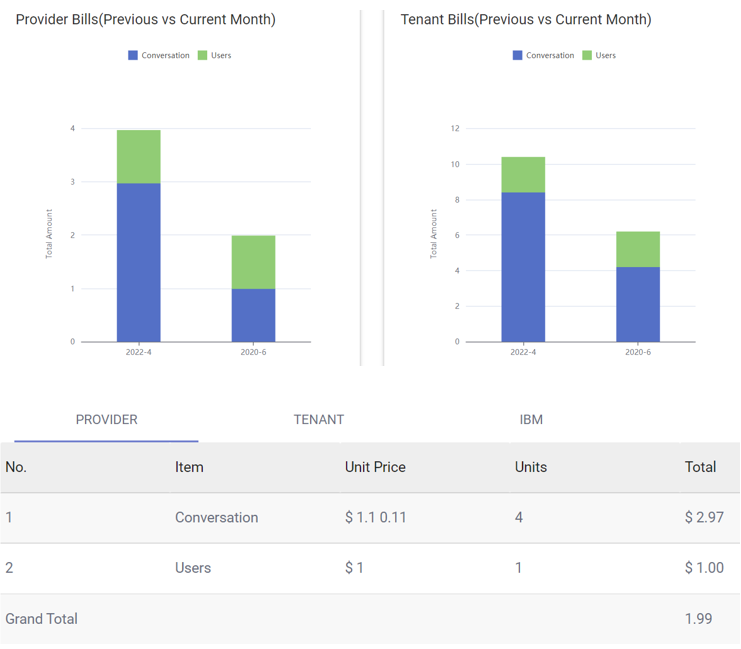
- It shows the break-up of the charges applied to a provider by HCL or to a tenant by
the provider post their bill generation. Users can use the month filter given at the top
right corner of the dashboard to filter the data.Note:These numbers shown in the images above are indicative in nature; the exact figures will be based on actuals.
- On the Tenants screen, click
-
The dashboard comprises two panes:
- Provider: It shows the collective amount charged to a provider for each
component listed in the Item column by HCL.
Figure 4. Provider Billing View 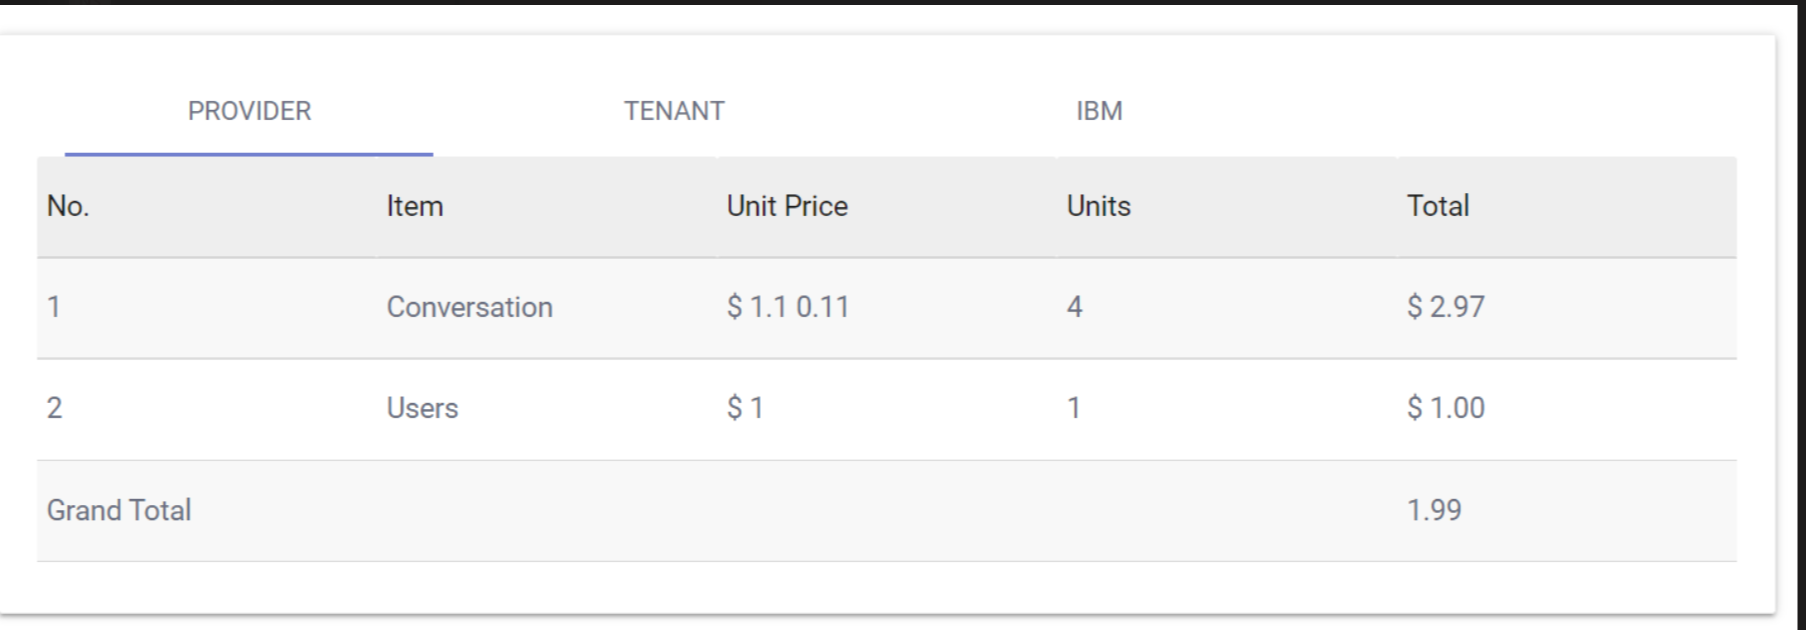
- Tenant: It shows the amount being charged to the tenant for each component
listed in the Item column by the provider.
Figure 5. Tenant Billing View 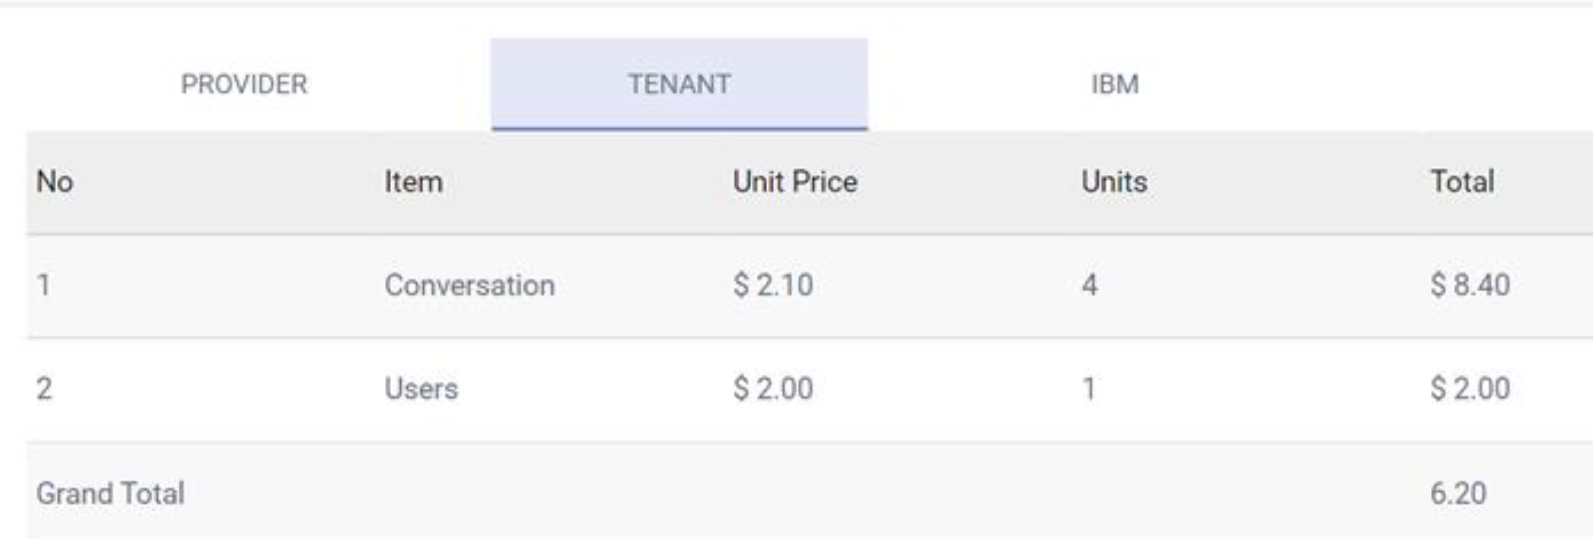
- Provider: It shows the collective amount charged to a provider for each
component listed in the Item column by HCL.
- Listed below are the details of the columns displayed in Tenant Billing View :
- Item: Type of the billing components. Each billing component is charged separately.
- Unit Price: The unit price levied on the component.
- Units: The number of units consumed of the component.
- Total: The total amount charged for the units consumed in each component.
The Grand Total gives the total of all the individual components.
- The following figure comprises of two pie charts.
Figure 6. Pie Chart for Pricing and Markup 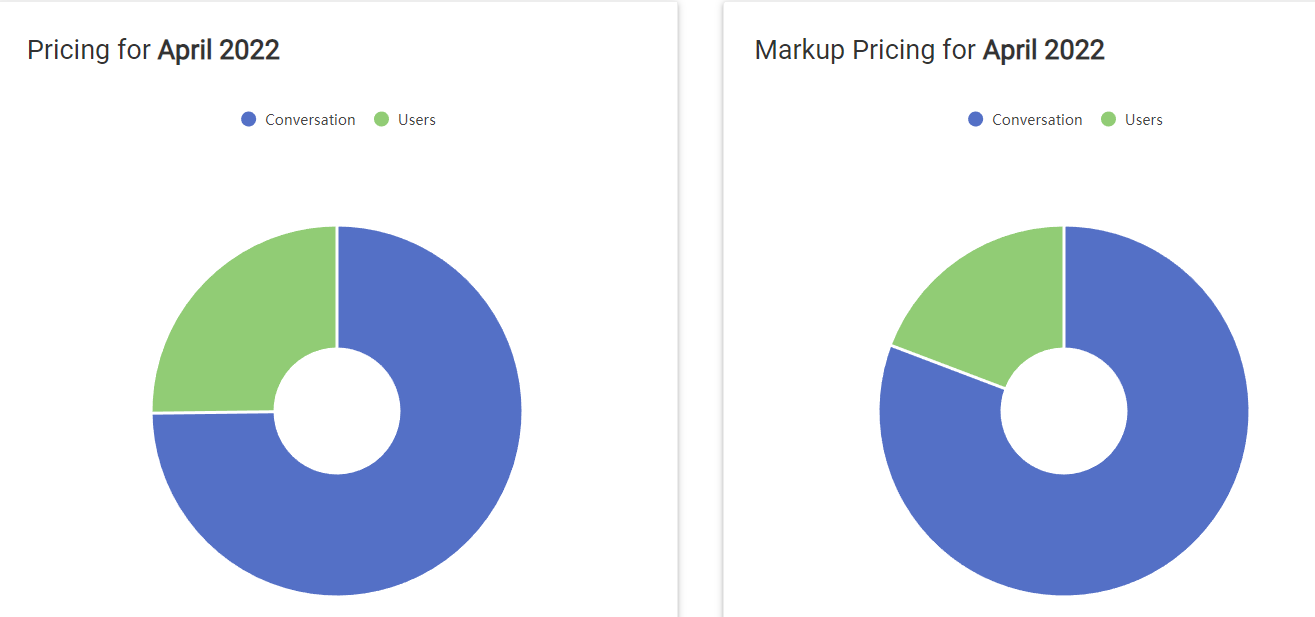
- Pricing: It represents the total amount charged to the logged in provider by HCL. Each wedge in the chart represents an individual component’s collective amount charged to the provider by HCL.
- Mark Up: It represents the markup amount levied on the tenant by the provider. Each wedge in the chart represents an individual component’s mark-up amount charged to the tenant by the provider.