Events Trends
This page talks about overview of how to plot a chart to view event trends based on a segment.
This page provides a visual representation of user event data over time. You can compare customer segments using up to two distinct events to analyze behavioral patterns across different cohorts. This limitation applies to all filtering, matching, and logical evaluation operations involving event data within segment definitions.
Plot a Chart
- From the menu bar, click Analytics > Events > Trends .
- In the Segment section, choose the date range from the calendar. You have options to select Last 7 days, Last 30 days, Last 60 days and Last 90 days. Also, you can select a custom date range from the calendar and click Done.
- Select a segment for which the event trend to be plotted.
- In the Event Trends section, select an event from the drop-down list.
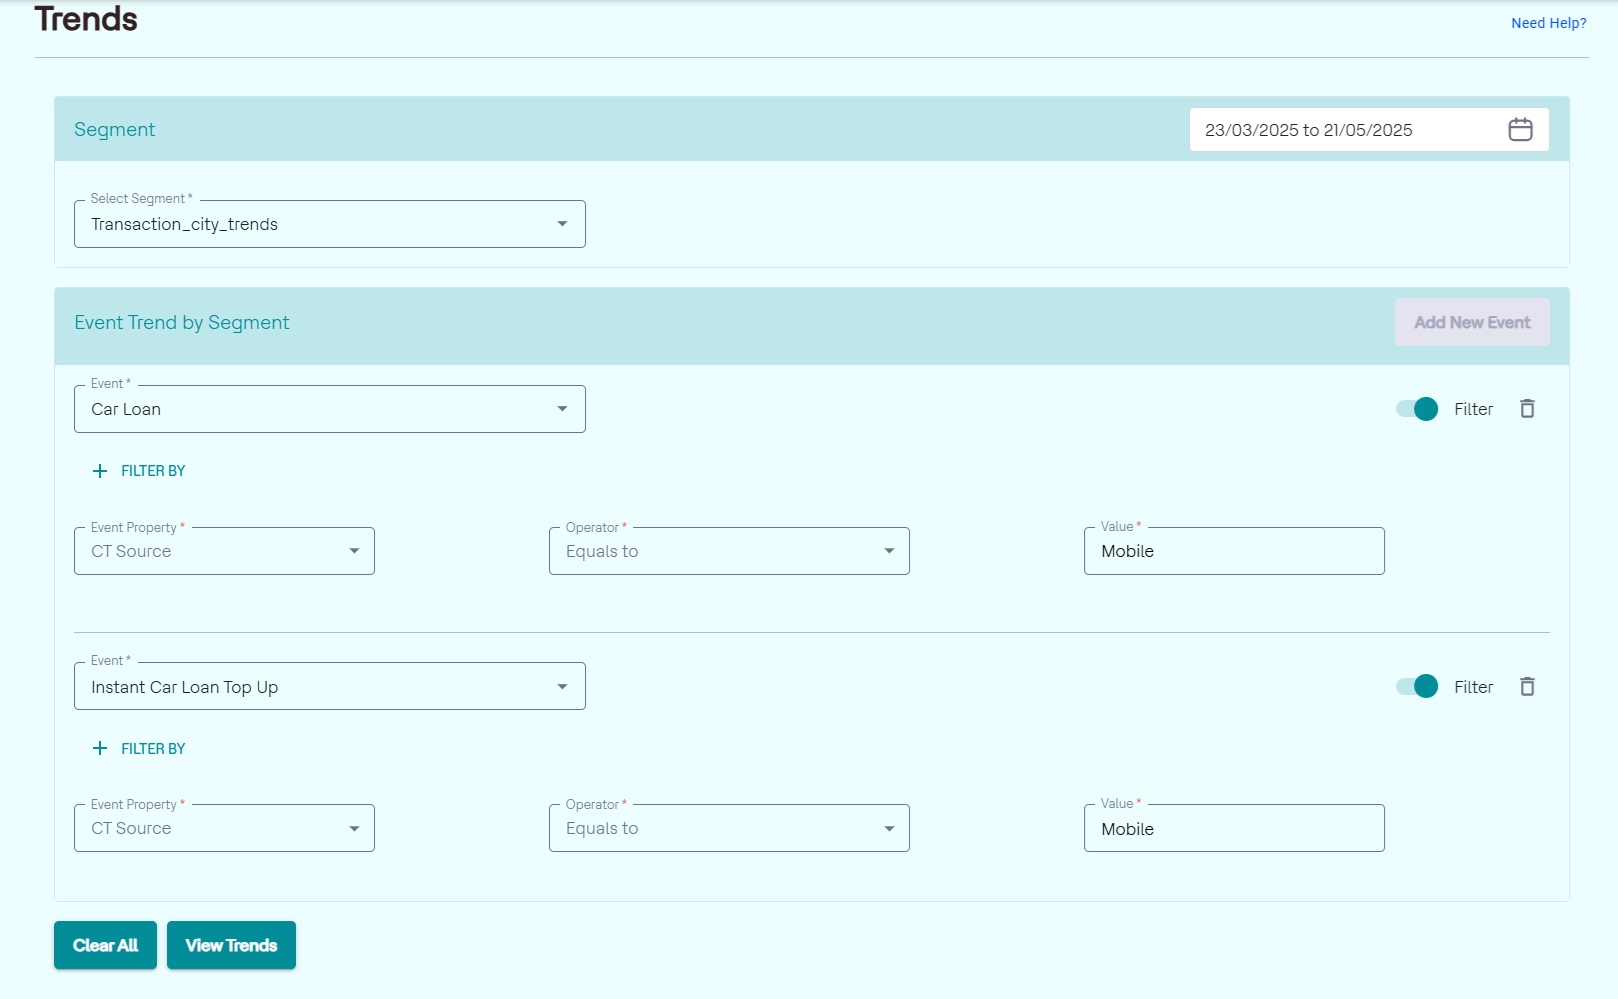
- Select the Event Property, Operator, and enter the property value. To add more event filter properties, click + FILTER BY.
- Further, to add another event from the segment, click Add New Event and follow the above two steps.
- Click View Trends to view the Event Trend chart for audience
from the selected segments.
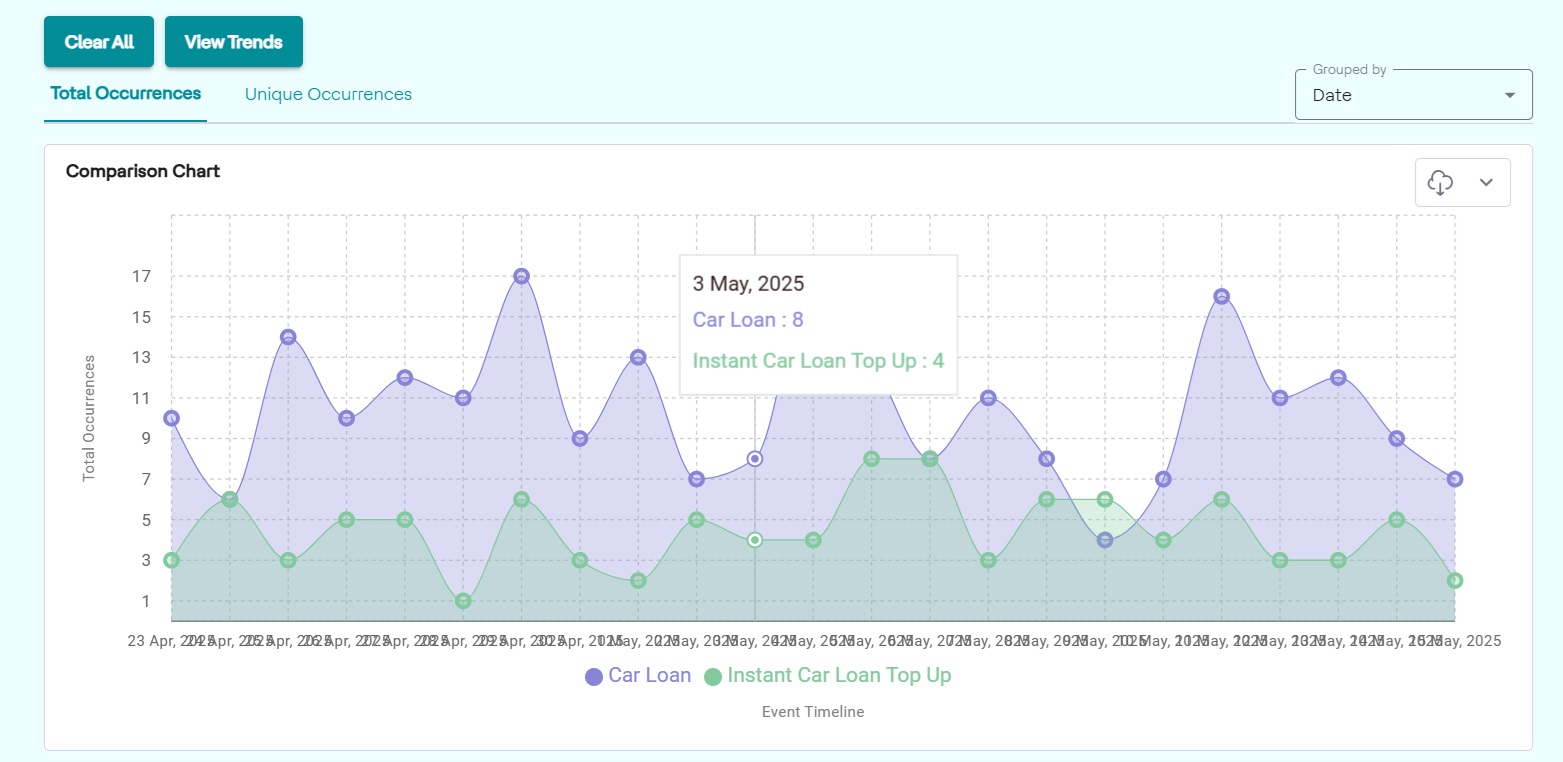
- Click the cloud icon at the top right corner of the chart to download the chart in either JPG or SVG formats.