Events Occurrence
This page talks about overview of event occurrences, their types, and how to plot a chart.
Interaction events- These are all interactive tracking events, such as page views, identity checks, and screen views.
Event Occurrence in Reporting feature lets you analyze event occurrences based on the total number of events and the number of users associated with each event.
For example, if a marketer wants to know how often a particular event has occurred within a set time-frame, they can track user activity through this feature.
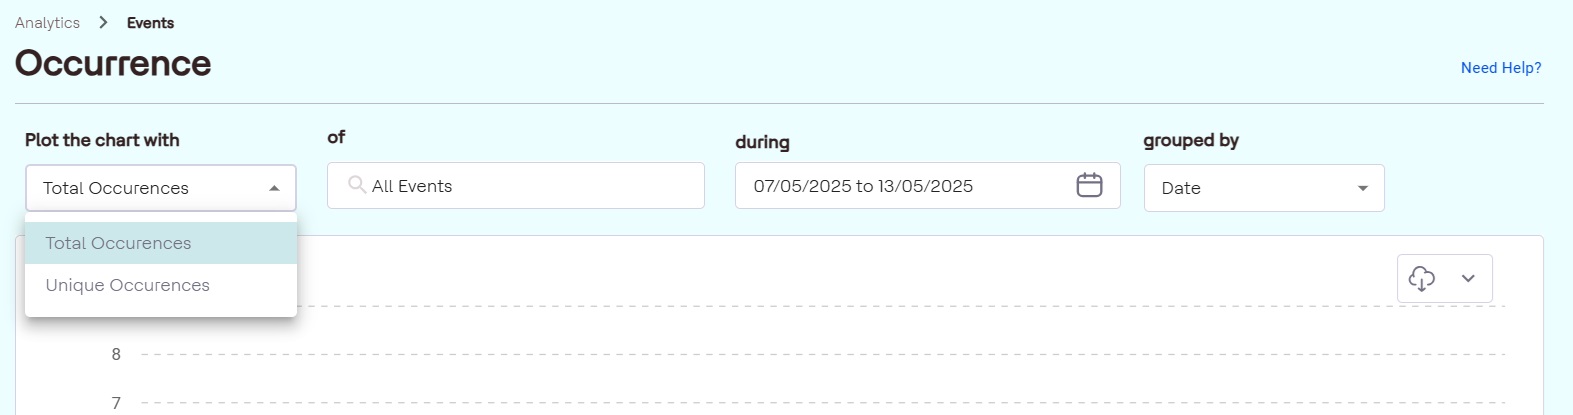
There are two types of Occurrences:
- Total occurrences
- Unique Occurrences
Unique occurrence will always be less than the total occurrence, this is because total occurrence is based user activities; whereas, unique occurrence depends on the user.
- Total Occurrences: This represents the total number of times an event has occurred within the specified time-frame, regardless of the number of users. For example, if you want to know the total event count without considering individual users, total occurrences will provide this data.
- Unique Occurrences: This shows the number of users who performed a specific event within the defined time-frame, regardless of how frequently the event was performed. This is helpful for seeing how many unique users engaged in an event.
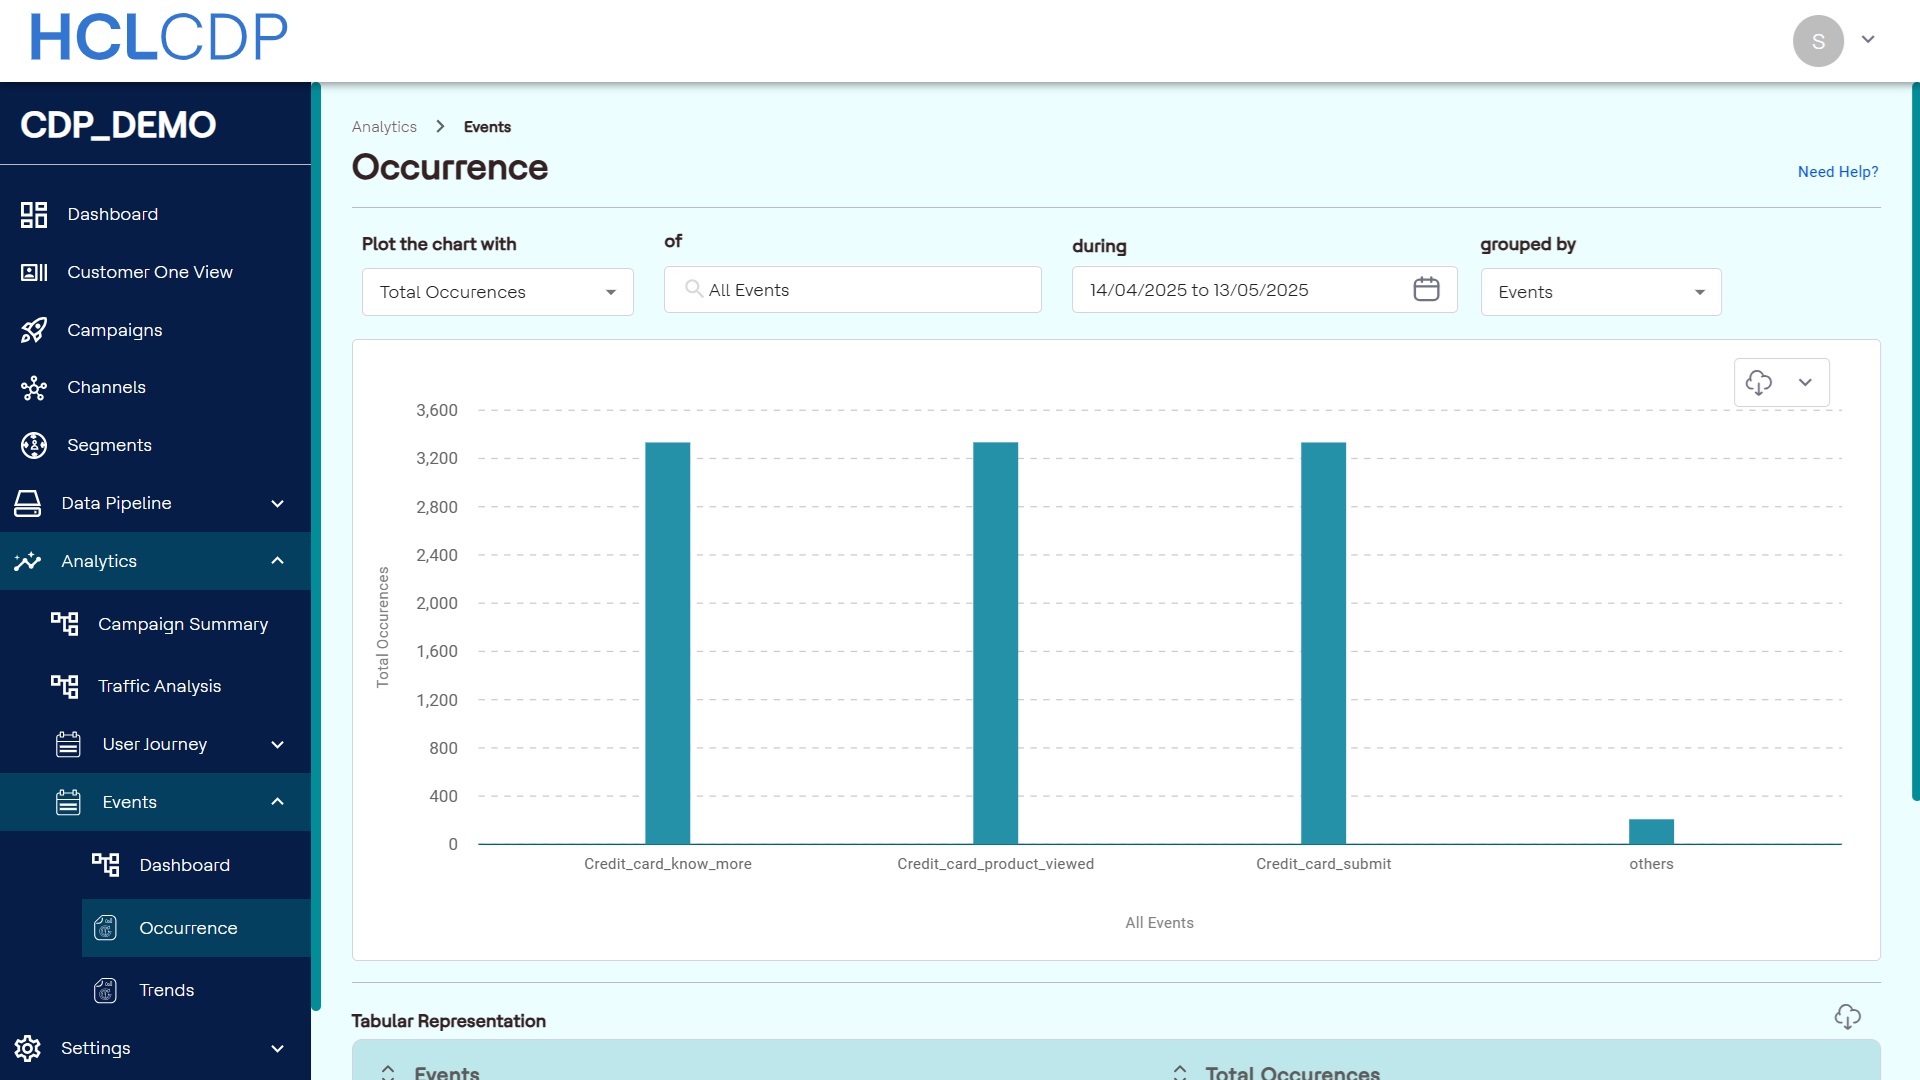
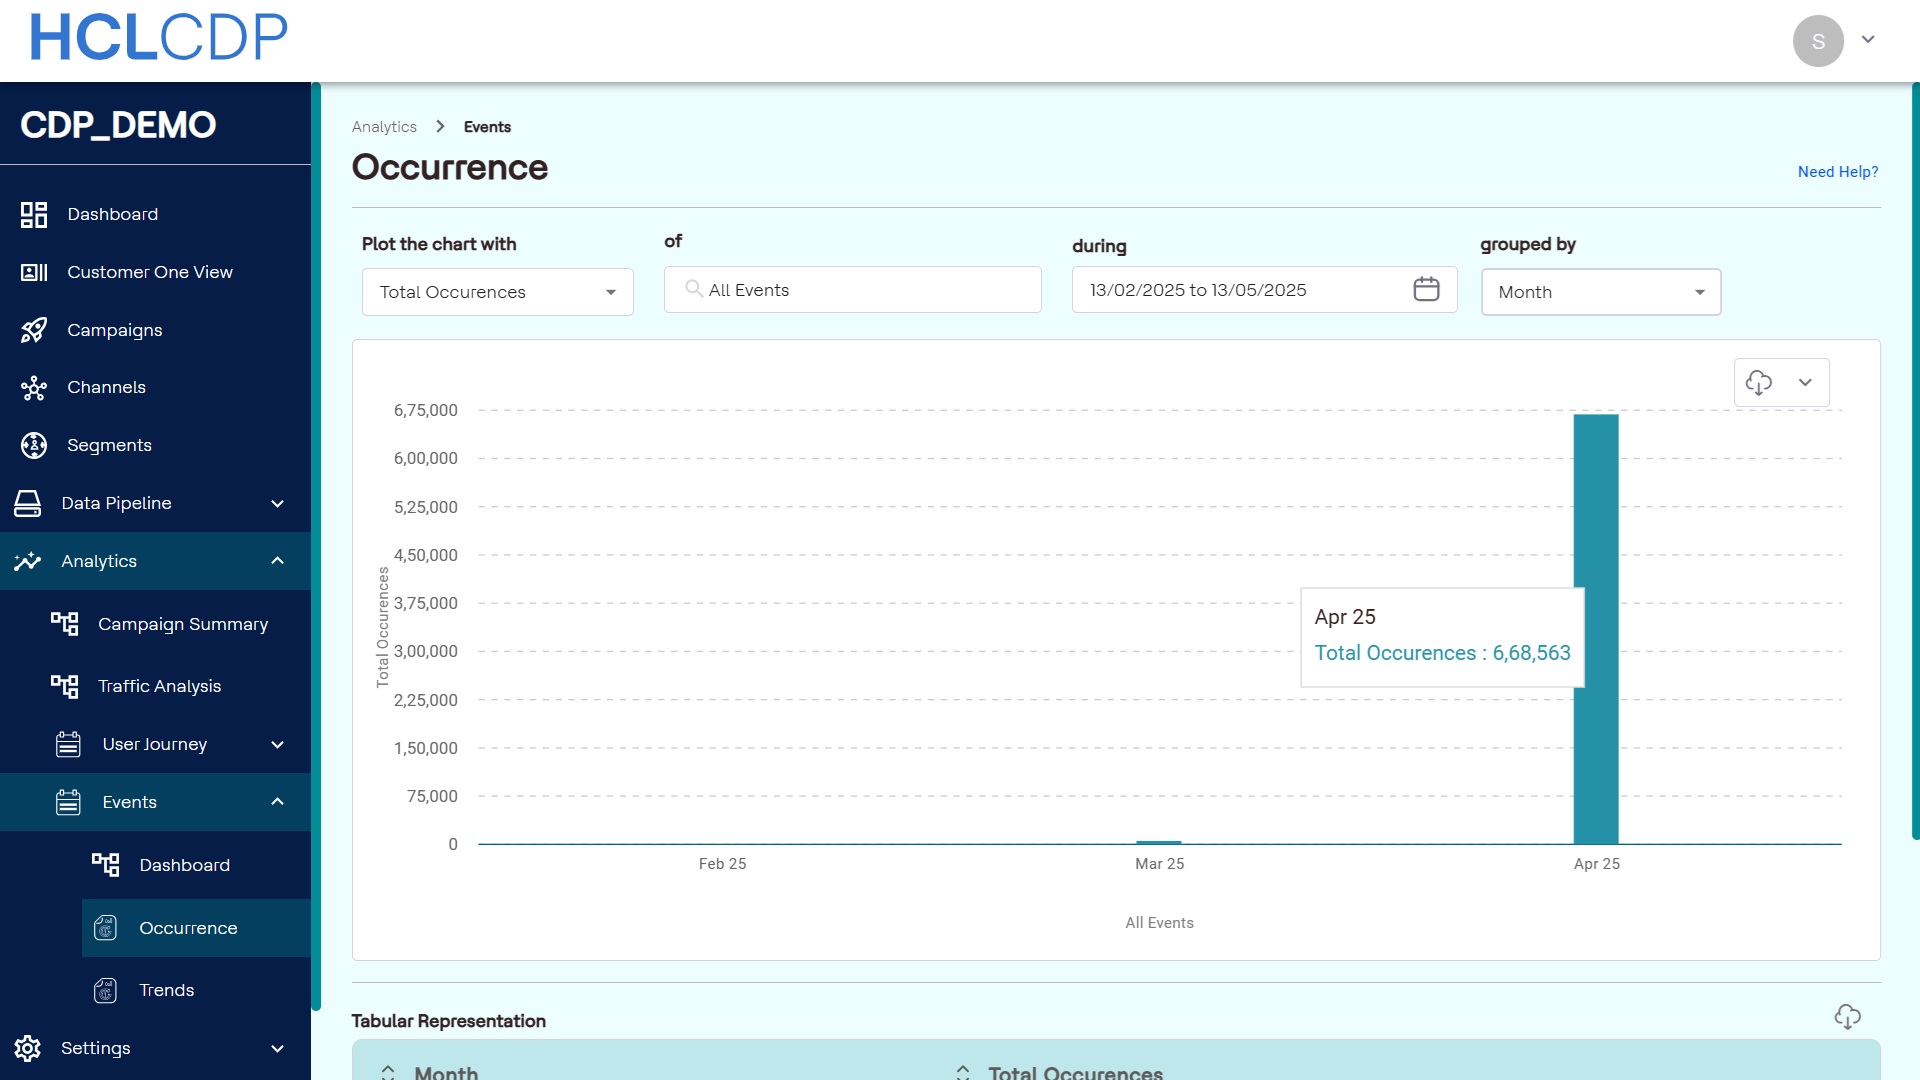
Plot a Chart
- Locate event occurrence in CDP navigate to Reports > Events > Occurrence.
- Choose to view either the total or unique occurrences of the events.
- Select all events or a specific event from the list.
- Pick a start date and drag to set an end date.
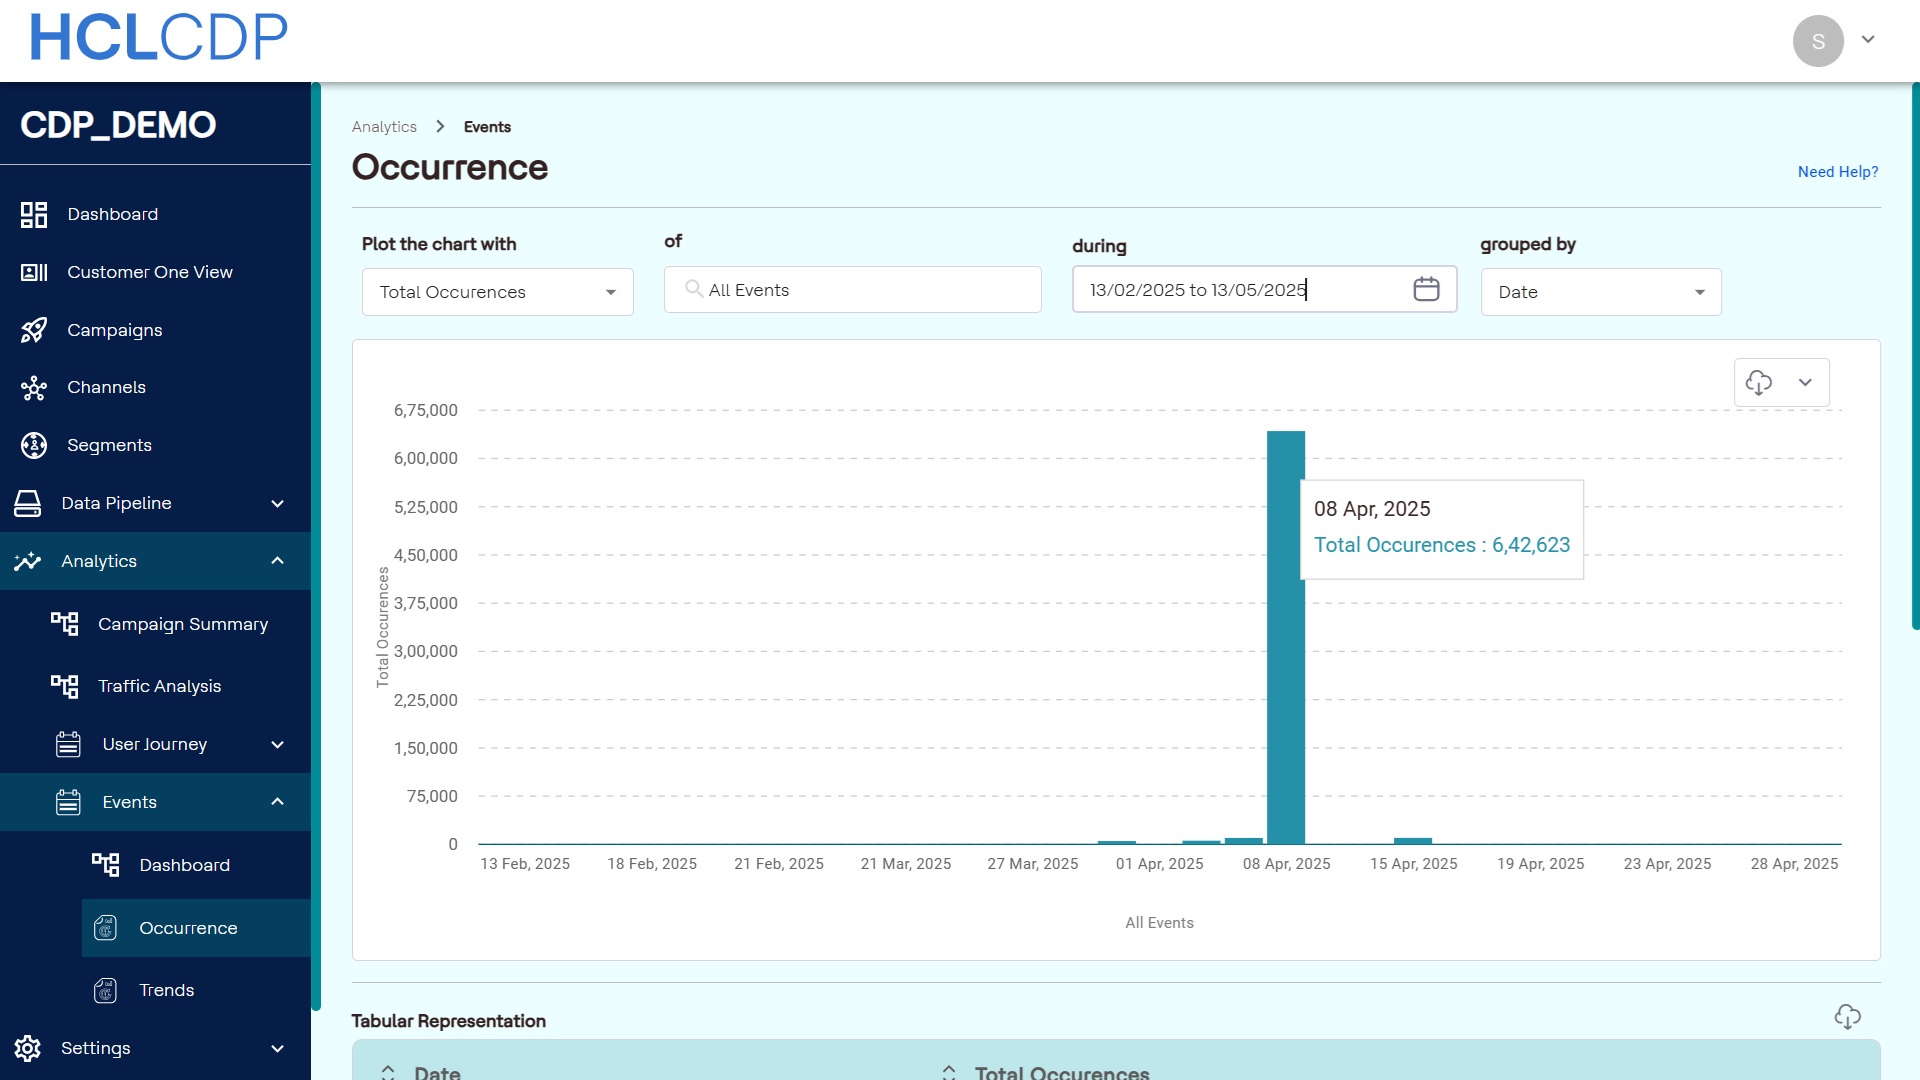
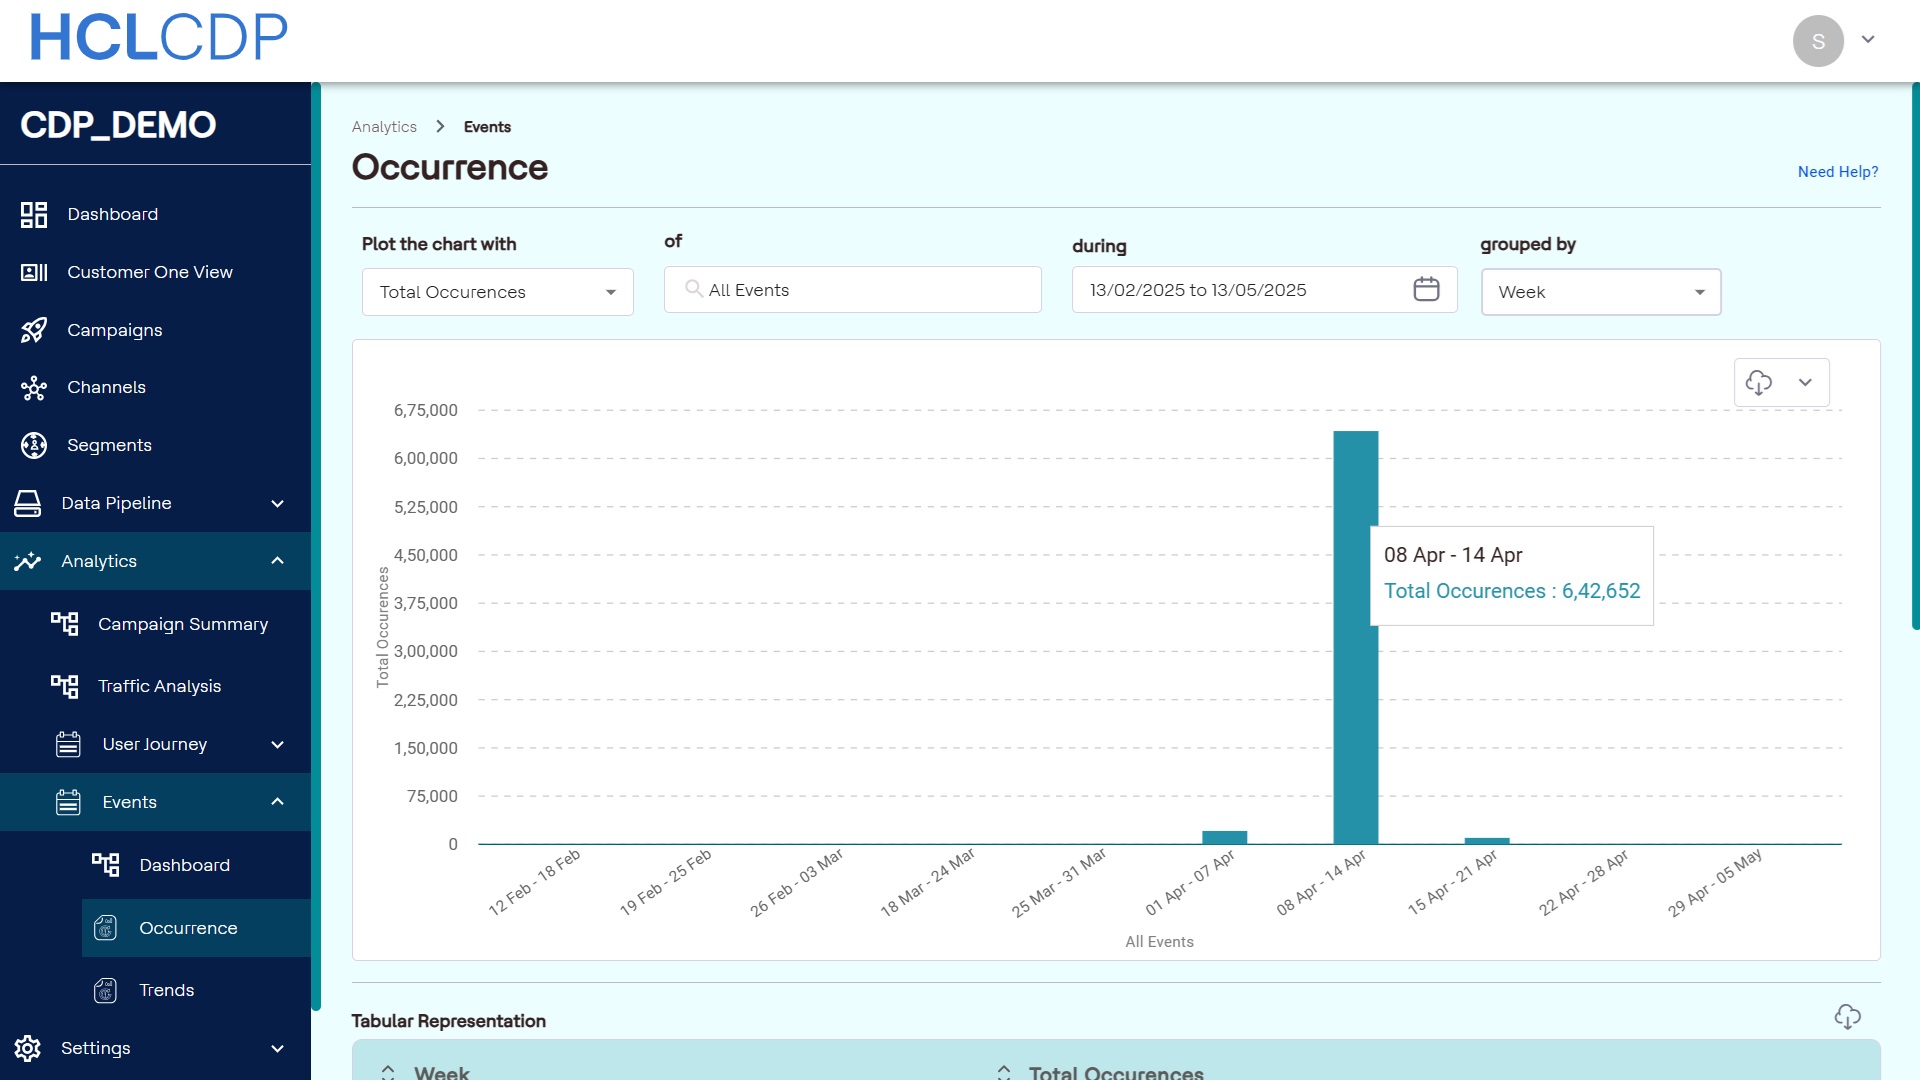
- Organize the data by date, week, month, or event.
Date: Displays groups occurrences by selected dates.
Week: Displays groups occurrences by week.
Month: Displays groups occurrences by month.
Event: Displays counts of all events, allowing comparison of event occurrences.