Agile Churn metric
The Agile Churn metric is the ratio of the sum of the values of story points added and removed to the value of the planned story points of a sprint. It calculates the percentage of the change in planned scope for any sprint. By using this metric, you can learn how the change in planned scope impacts the progress and completion of the sprint.
Velocity calculates the Agile Churn metric by using the following formula:
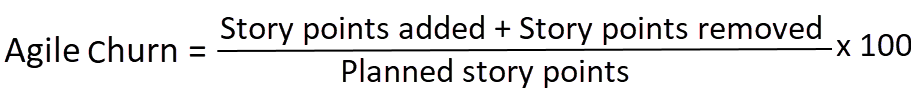
Where:
- Story points added: The total value of the story points of the issues that are added to the sprint.
- Story points removed: The total value of the story points of the issues that are removed from the sprint.
- Planned story points: The total value of the story points of the issues of the sprint that are present at 24 hours of offset time after sprint start time.
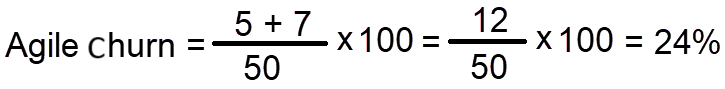
Consider a sprint had a total planned story points of 50 at the end of 24 hours of offset time completion after sprint start time.
An issue with story point of 5 is added to the sprint after completion of 24 hours of offset time from the sprint start time.
An issue with story point of 7 is removed from the sprint after the completion of 24 hours of offset time from the sprint start time.
Therefore, Velocity calculates the Agile Churn metric as follows:
Display of the Agile Churn metric in Velocity
In Velocity, the Agile Churn metric is displayed on the Dashboards and Value Streams pages:
- Dashboards page: Agile Churn is displayed in the Dashboards by using a graph, which dynamically shows the average churn percentage over time. You can group by days, month, week, quarter, year or with custom dates.
- Value Streams page: The Value Streams page shows
the Agile Churn for changes in a specific value stream. It shows the percentage
of churns in the value stream over the last 90 days.
The result is presented on the Value Streams page, which helps stakeholders to view the overall stability and reliability of the deployment process for the value stream.
Adding the Agile Churn metric chart to Velocity Dashboard
- Click .
- Perform any of the following steps:
- Click any existing dashboard to open the dashboard.
- Click Add new dashboard, provide the name and description for the dashboard, and then click Add.
The dashboard is displayed.
- Click Add charts and in the Delivery
Flow category, click Add for the
Agile Churn metric.
The chart is displayed on the dashboard.
If the dashboard already contains charts, the new one is inserted in the top row. Data that matches the filter condition populates the chart.
Adding the Agile Churn metric in the value stream
Perform the following steps to add Agile Churn metric in the value stream:
- On the Home page, click .
The Value Streams page is displayed.
- Click
 to display the metric bar.
 - Click
 to display the Add Metrics
window.
to display the Add Metrics
window. - In the Delivery Flow category, click Add for the
Agile Churn metric.
The Agile Churn metric is displayed in the value stream.