The Analytics page displays how shoppers use the
Search feature in the store. Currently, only stores using elastic
search are supported. Users can view the analytics dashboard in the Search tool only after
completing the dashboard configuration.
This page provides information about search performance, such as Search Term Trends,
Search Term Revenue, Search Term Refinements, Top searches, Search Misses, Search
Hits, and Search Exits.
Note: The Search tool supports Universal Analytics and
Google Analytics 4 integration for reporting. The fields
displayed on the screen vary depending on the configuration.
Note: Analytics has several standard and calculated metrics
considered currency values. The global currency type of property (GA4) or
reporting view (UA) determines the Currency in which all these values are
displayed in reports. By default, the global currency type of a property or
reporting view is USD. Businesses transacting in a currency other than USD can
configure a property or reporting view to use any of the supported currencies in
the Property Settings or View Settings page. See
[GA4] Currency reference - Analytics
Help for more information.
Once configured, log in to the Commerce Lab. From the hamburger menu,
select . The Analytics dashboard page will be displayed as shown below:
Users will be able to access only Customer-facing stores like Ruby and RubyB2B. The
Search tool cannot be used with stores like Catalog asset store or Storefront asset
store.
Note: The user will only be able to see the selected data after the
store's configuration.
Select Store from the list of available stores.
Select Currency from the list of available currencies.
Select a
Language from the list of available
languages.
Note: The user will get several languages listed only after adding
these languages to the selected store. Go to
Updating store information. The list of currencies and
languages depends upon the selected store.
Select Dates from the calendar. Data will be displayed based
on the store's Start Date and End
Date.
The data shown on the dashboard is displayed for the selected store. Users can click
the Refresh button shown on the top right corner of the page
to get the updated data from the store.
Click
Hide Filters, and all the filters will disappear from
the screen. To See the filters again, click on the
Show
Filters icon in the top right to see the filters again.
Note: Filters will be hidden by default. Click on the Edit
filter to change the values.
Unless the dashboard is configured for the store, user will not be able to view the
data for selected store. A misconfiguration page will be displayed.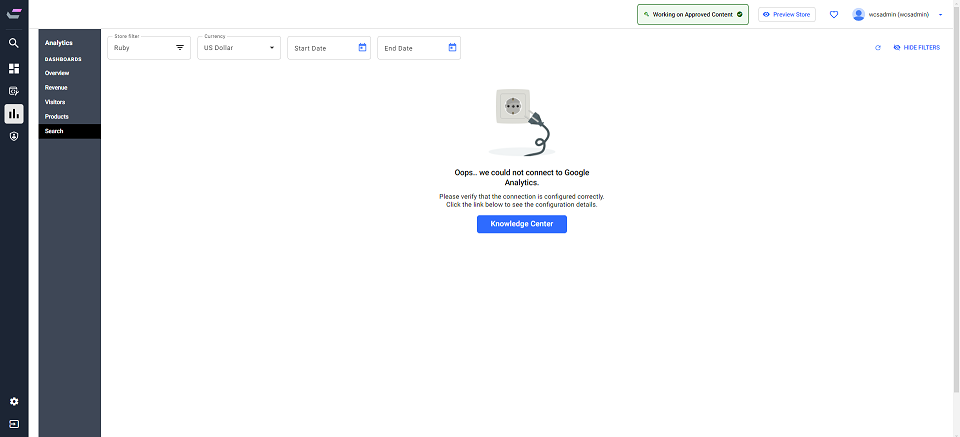
To view the analytics dashboard, configure the dashboard first. To view the
configuration details follow the steps given in below document:
Users with below roles can access
Commerce Lab to use Analytics
dashboard:
- Site Administrator
- Seller
- Product Manager
- Category Manager
To know more about search performance terms and information, view the Search Analytics Dashboard.