You can monitor Index Load and use the metrics to tune Index Load for optimal
performance.
About this task
You can monitor Index Load in the following ways:
- Interactively, by using the Index Load status command while indexing.
- After running Index Load, using the search administration logger.
Procedure
Use the metrics that are displayed by the Index Load status command while indexing to help
refine tuning parameters and improve performance throughput:
-
Go to the following URL:
https://hostname:searchadminport/search/admin/resources/indexload/profile/$profileName/status.
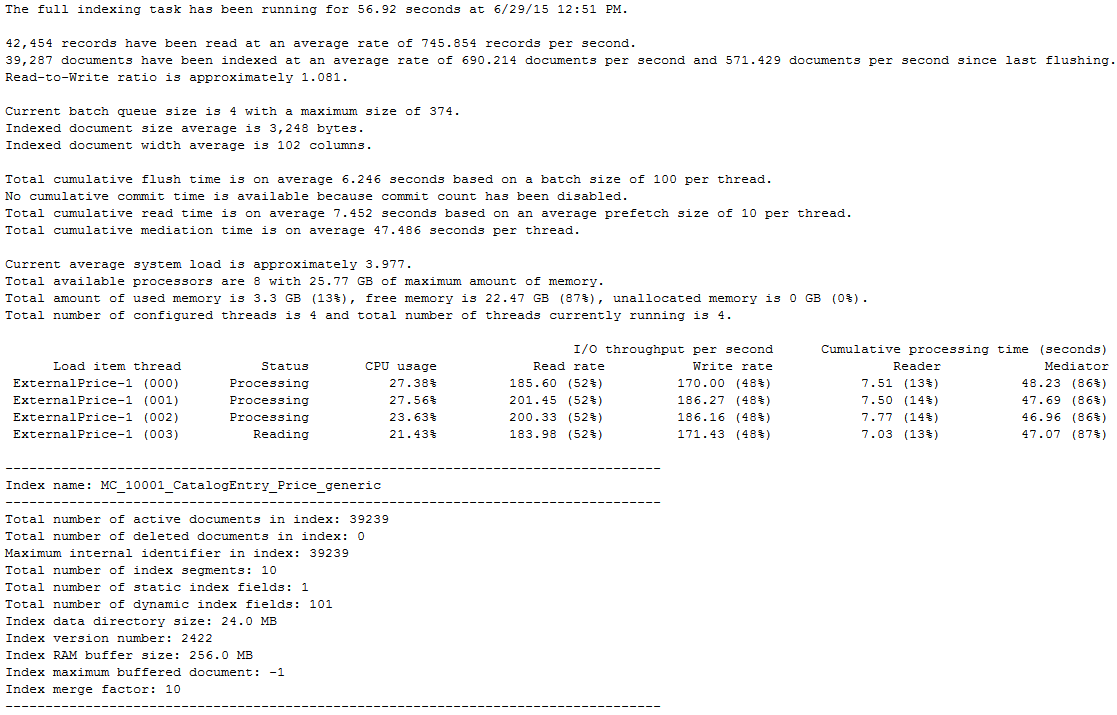
The status report is displayed and shows its metrics.
For example:

-
Review the status report and further adjust the tuning parameters in this task
accordingly.
The status report contains the following considerations:
- The overall read rate and indexing rate.
- The batch queue size in memory with the high water mark, showing the peak memory
consumption.
- The average document width and size in bytes.
- The cumulative flush and commit time.
- The time that the system resources are utilized. That is, the CPU time and heap memory.
- The index data directory statistics with related Solr configurations.
