Dashboard
The dashboard provides with a quick access to information about deployments, scans, computers, and software assets in your infrastructure.
 Dashboard and reports
Starting from 10.0.2.0, BigFix Inventory default dashboard displays vendor-specific predefined reports available in dashboard summary of the selected inventory reports and a preview of the security features. The reports are grouped in a specific order. For more information, refer to Vendor-specific predefined reports available in dashboard Inventory Reports.
To view the old dashboard, click Inventory Health. You can set the previous or new dashboard as your default dashboard when required. To do so, click the user icon and select Set as homepage.
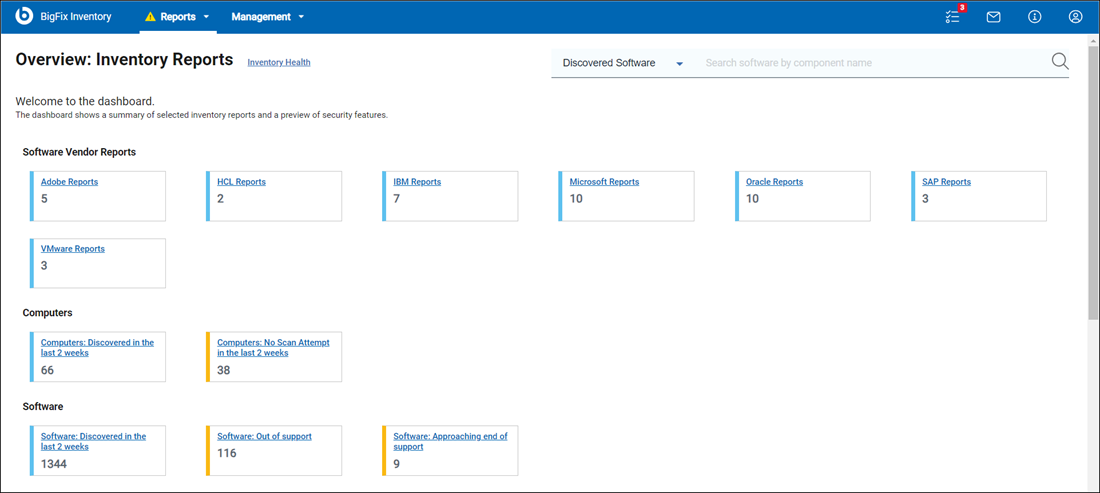
The reports are grouped to help you find all your related reports together. For more information about the reports, refer to Available reports.
Use the search option to search your preferred reports. You can search with file name, file hash, CVE name, and software component. To search your preferred files, use File Name or File Hash. Enter the software component name to discover the software. To search data about vulnerable software, use CVE name. The default search filter is set to Discovered Software.
![]() The quick search on the top right corner allows you to search contracts
with contract name.
The quick search on the top right corner allows you to search contracts
with contract name.
Inventory Health
Deployment Health
Deployment Health widget shows whether BigFix clients that are installed in your infrastructure are connecting to the BigFix server. It also reports the most common issues that occur when clients are operating such as, problems with disk space or missing scanner prerequisites.
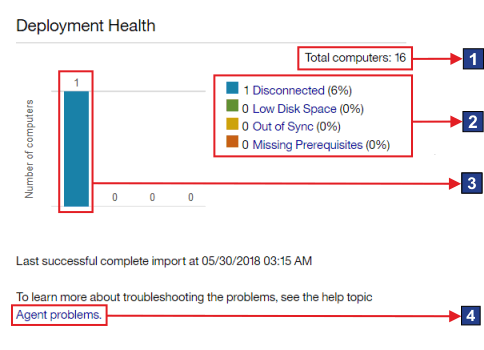
- Elements of the widget
 The total number of computers to which the user has access. The number
is determined by the computer group to which the user is
assigned.
 The total number of computers includes Mac computers. However,
information about deployment health is not collected from these systems.
Thus, they are not included in the counts for particular
statuses.
Software Scan Health
The Software Scan Health widget shows the health of scans that are running in your infrastructure. When software scans are not working correctly, the installed software might not be discovered.
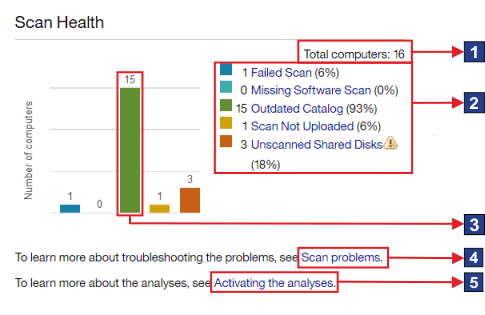
- Elements of the widget
 The total number of computers to which the user has access. The
number is determined by the computer group to which the user is assigned.
 The total number of computers includes Mac computers. However,
only information about the status of the package data scan is collected
from these systems. Therefore, Mac computers are included in the count
for the Failed Scan status. They are not included in the counts for the
remaining statuses.
Capacity Scan Health
The Capacity Scan Health widget shows whether capacity data is correctly gathered from the computers in your infrastructure. The lack of capacity data might impact calculation of PVU consumption.
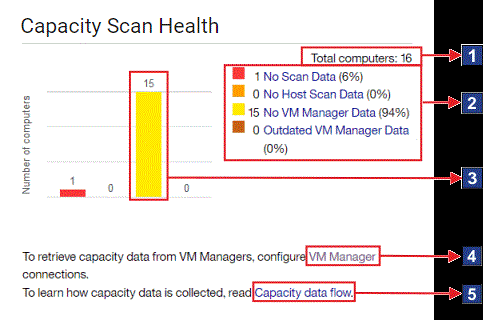
- Elements of the widget
 The total number of computers to which the user has access. The
number is determined by the computer group to which the user is
assigned.
 The total number of computers includes Mac computers.
However, information about capacity data is not collected from these
systems. Thus, they are not included in the counts for particular
statuses.
IBM Software Classification
The widget shows the number of completed and pending classifications of the software that is installed in your infrastructure.
The accuracy of the displayed data depends on when the scan data was imported and whether the part numbers file is up-to-date. If any of these factors was changed, an appropriate message is displayed on the widget.
If the widget shows No data, the data is not available. It might
occur when scan data was not uploaded, the upload of the data has not finished yet,
or inventory scans do not work properly. The message is no longer displayed if scan
data from at least one BigFix
client is successfully updated.
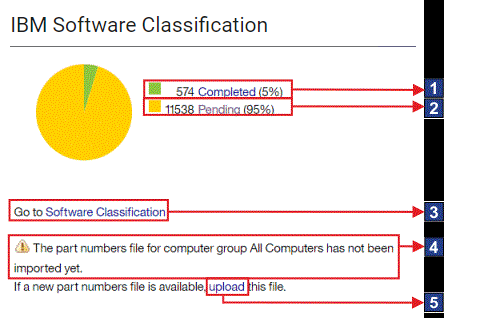
- Elements of the widget
 A link to the Software Classification
panel with results narrowed down to software installations with complete
classification.
 Links to the report with results narrowed down to computers with
the particular status.
 The number of computers with a particular status.
 Link to information about
  Link to information about