Navigation bar
The navigation bar on the left side of the screen toggles you between the main steps used in a typical workflow. It can be collapsed to allow more space for data display.
 |
Dashboard | The dashboard shows an aggregated summary of the current scan data, and updates in real time as the scan progresses. |
 |
Configuration | Opens the Scan Configuration dialog box with access to all configuration options. |
 |
Data | Shows script parameters, interactive URLs, visited
URLs, broken links, filtered URLs, comments, JavaScripts, and
cookies from the Explore stage. Application Tree: Complete application tree. Result List: Select a filter from the pop-up list at the top of the Result List, to determine which information is displayed. Detail Pane: Filtered list of: script parameters, interactive URLs, visited URLs, broken links, filtered URLs, comments, JavaScripts, and cookies. Unlike the other two views, Application data view is available even if AppScan® has only completed the Explore stage. Use the pop-up list at the top of the Result list to filter the data. |
 |
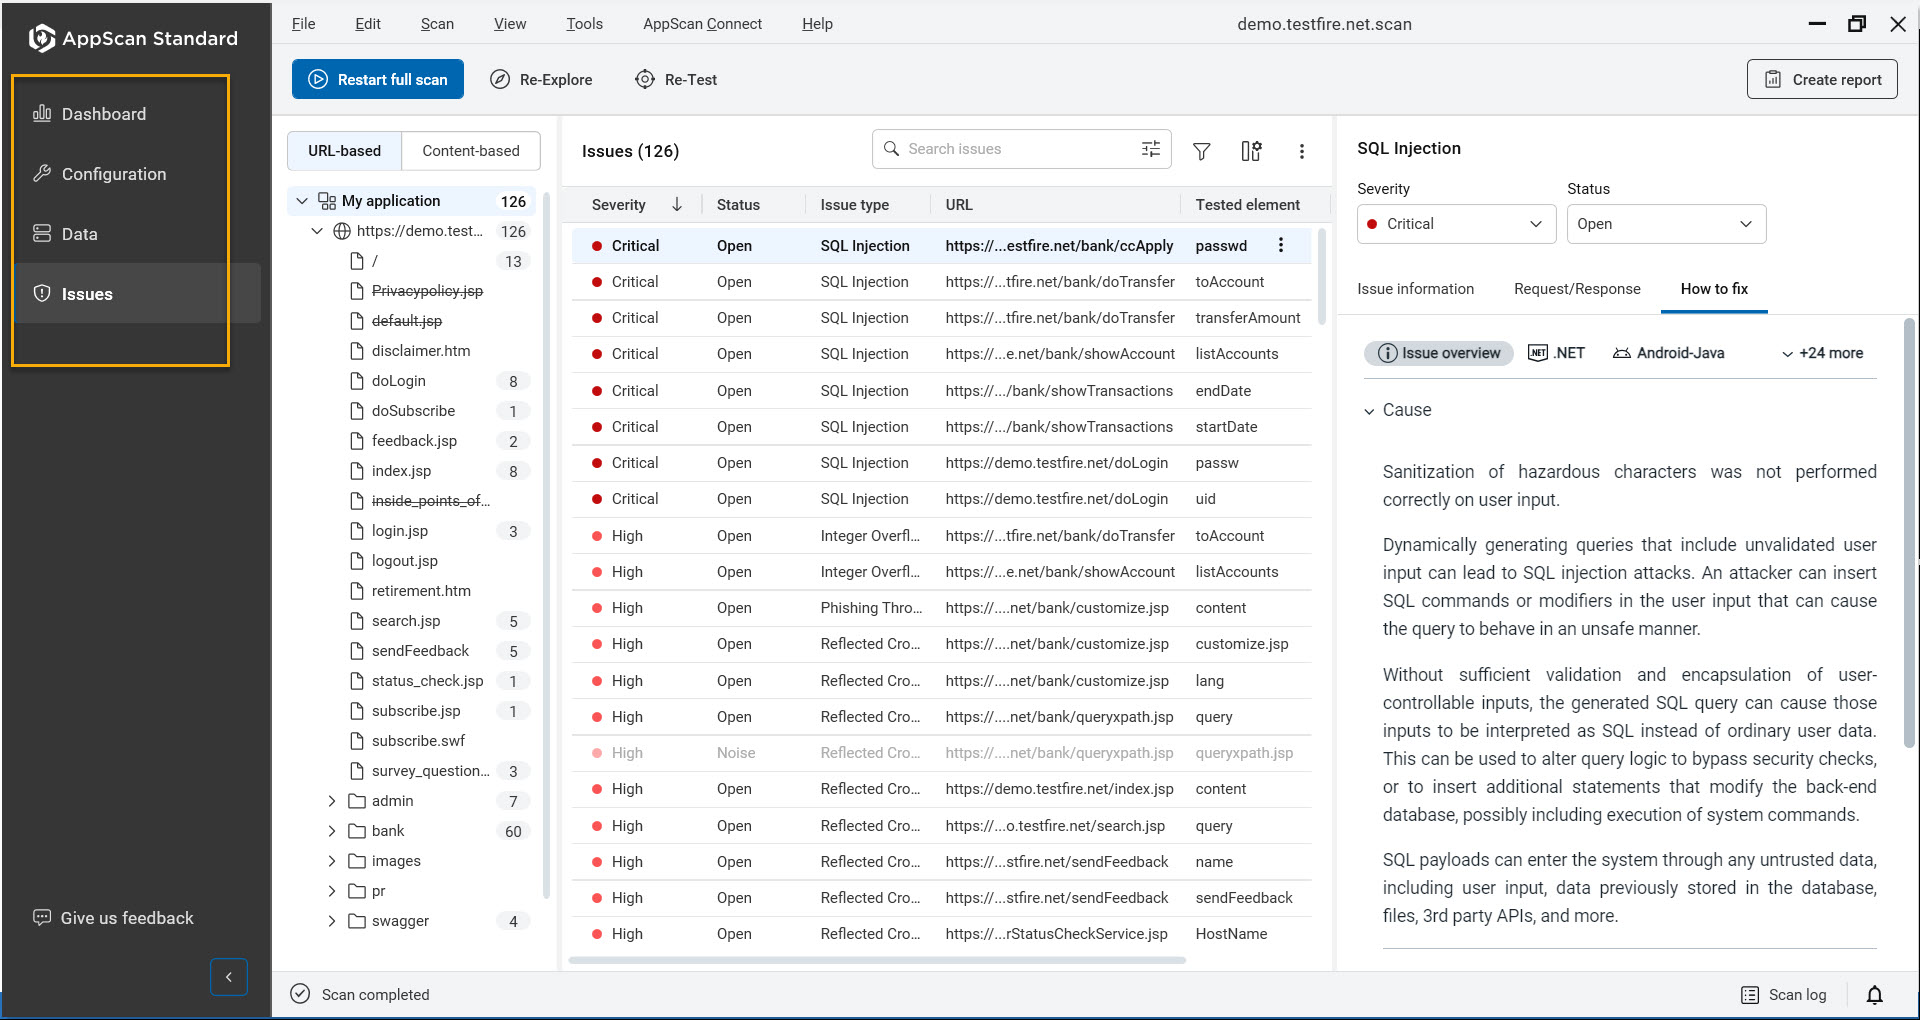
Issues | Shows the actual issues discovered, from overview
level down to individual requests/responses. This is the main
view. Application Tree: Complete application tree. Counters next to each item show the number of issues found for the item. Result List: Lists issues for the selected note in the application tree, and the severity of each issue. Detail Pane: Shows how to fix suggestions and request/response (including all variants used) for the issue selected in the Result List. |