Graphical View - modelling
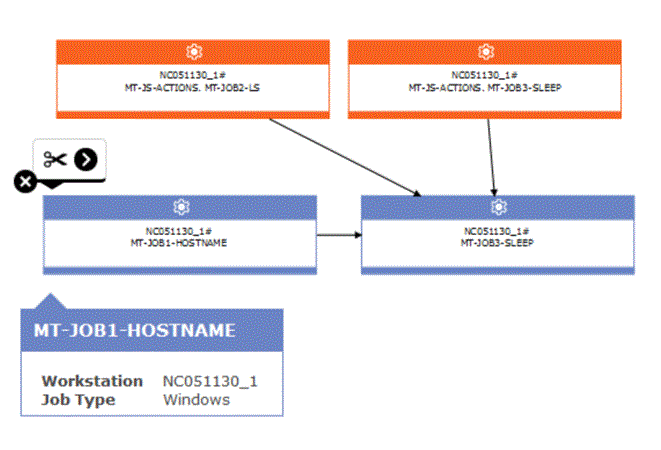
Use this panel to graphically view the selected job or job stream with its dependencies in the Workload Designer.
This view shows the jobs contained in a job stream and their associated dependencies or the job stream dependencies. When you select an object in the graphical view, the object properties are displayed at the bottom of the properties pane. In distributed environments, the flexibility of the layout in this view enables you to reposition objects in whichever way is most useful or meaningful for you. If you save changes to the layout, the changes are maintained the next time you open the same job stream in the Graphical View, and also if you open the same job stream in the Job Stream View. In a z/OS environment, and in the case of a connection to a previous version of the engine, any changes made in the layout persist for the current browser session only. Changes to the layout cannot be saved to the database in a z/OS environment or when the engine connection is an engine of a release previous to 9.4.
For a description of the shapes and icons available in this view, as well as in the Job Stream View and Plan View, see Graphical views in the plan.
The same information and actions available from the Details pane are also available from the Graphical View.
You can select or open objects in the Welcome page and work on them in these panes to edit your definitions as required.

- Use this toolbar to rapidly manage the view.

- Use these icons or the slider bar to zoom in or out from the view. The percentage of the view is displayed.

- Use this icon to adjust the zoom level of the view so that all the objects are shown at the maximum resolution.

- Use this icon to adjust the view to full screen size.

- Use this icon to dynamically calculate the best size and position of all the objects in your view.

- Click this icon to highlight all the dependencies of the selected object.

- Click this icon to display or hide the job stream and job external dependencies in the graphical view. It can be useful to customize the picture granularity, especially in complex and large job streams.
-

- Click this icon to show or hide the job stream dependencies.

- Click this icon to open the graphic in a Scalable Vector Graphics (SVG) file. With this type of file, vector-based images can be scaled indefinitely without losing any quality. A vector graphic program uses these mathematical formulas to construct the screen image, building the best quality image possible, for the given screen resolution.

- Click this icon to open the graphic in a Portable Network Graphics (PNG) file. A PNG file is compressed in lossless fashion, which means that all image information is restored when the file is decompressed during viewing.

- Use this icon to print the view.


- Click this icon to remove the selected item from the view. Use it, for example, to remove a job from a job stream or a dependency from a job. The removal becomes effective only when you save the object.

- Use this icon to remove all the dependencies of the item.

-
Use this icon to create dependencies. Click the icon, click an item, and then draw a line to the job stream or to the job that represents the depending item. You can use this icon only to create dependencies from items displayed in the view and by drawing lines in the correct direction (from the dependency to the depending item).
Use this icon to also create a conditional dependency on jobs internal to the job stream. However, in this case, the job stream cannot be saved until you have manually updated the conditional dependency table, by specifying all the required information about the condition.

Dependencies
When you click a job stream or job dependency, you select its dependency relationship and you can remove it. If this item is a dependency for multiple items, click it again to select the next dependency relationship. If dependencies within a job stream form a loop, this is highlighted in a light yellow color in the view so that you can take the appropriate actions to resolve it. If you delete the dependency causing the loop, the highlighting disappears.
The arrows represent the dependency relationships; where the arrow goes from the dependency to the item that depends on it.
Dependencies can also be conditional. In the graphical view, this type of dependency is represented by a dash arrow.