Navigating the Dashboard
Procedure
- Log in to the HCLSoftware Unica platform using your credentials.
- In the left navigation pane, click Unica Detect and select Dashboard.
- Review the Performance Metrics section to monitor events and transaction
trends.
Figure 1. Unica Detect Dashboard 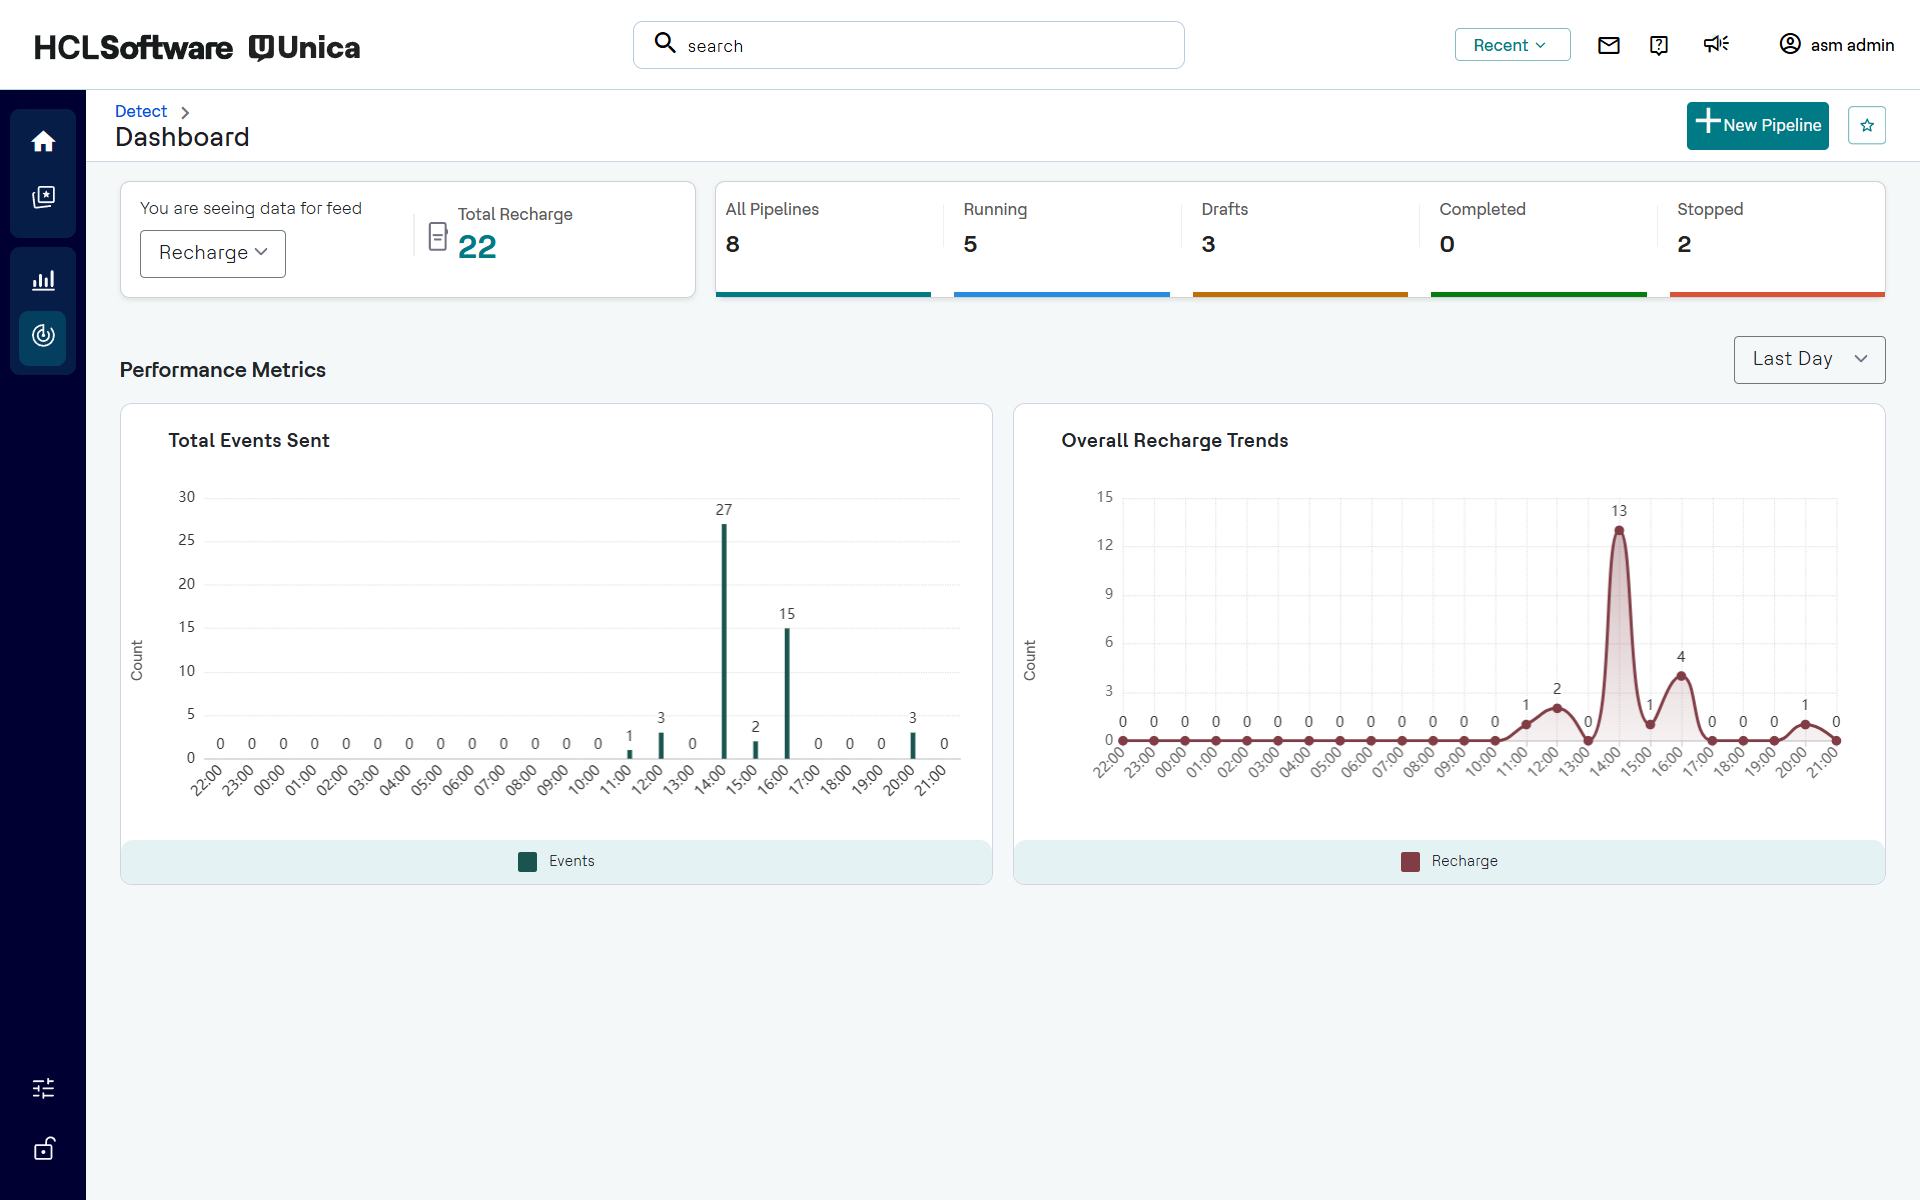
- Use the Feed drop-down menu in the upper left corner to view metrics related for the selected feed e.g., Recharge.
- Use the Time Filter drop-down menu in the upper right (e.g., Last Hour, Last Day, Last Week) to adjust the data visualization window.