Device Onboarding
Through this module, Users can place a request for installing the agent on the devices. Below are the steps of onboarding:
- On the main menu, click Onboarding then in the sub-menu click Device Onboarding .
- The Device Onboarding screen appears, and it lists down already placed
requests for agent installation in a tabular view.
Figure 1. Device Onboarding 
Add Device Onboarding
To add a new request for agent installation on the devices, follow the steps below:
- Click on Add Device Onboarding button.
- Select the Agent Type.
- Select Deployment.
- Enter Onboarding Name.
- Enter Onboarding Description.
- Enter Collection Interval.
- Check monitor database metrics. This option will allow user to provide details of monitoring databases on the next page.
- Now provide the host/IP details with username, password and OS type.
- Click on Next.
Figure 2. Add Device Onboarding) 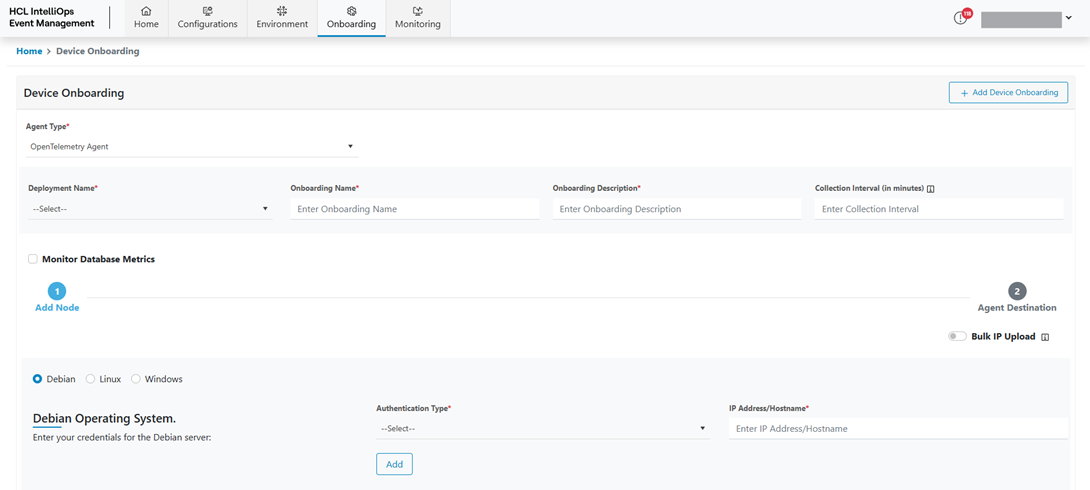 Note:Fields for the respective Integration Type can be different as per tool configuration.
 -
Refer to the table below to understand the fields mentioned in the above figure.
Table 1. Device Onboarding Fields Fields Description Agent Type This field contains the Agent Name for Agent Type. Deployment Name This field contains the Deployment name; we can select deployment from all Deployments. Onboarding Name This field contains the Onboarding Name. Onboarding Description This field contains the Onboarding Description. Collection Interval This field contains the Circuit breaker Event Threshold value. Device Type This field indicates the type of agents can be onboarding on the devices Authentication Type This field indicates the Authentication Type supported by the Devices IP Address/Hostname This field contains the IP/Hostname of the Device/VM Username This field contains the username of the Device/VM Password This field contains the password of the Device/VM Preserve Credentials Check this field when entering multiple Devices/VM with same credentials, otherwise for every Device/VM credentials need to be provided. Figure 3. Add node for Device Onboarding 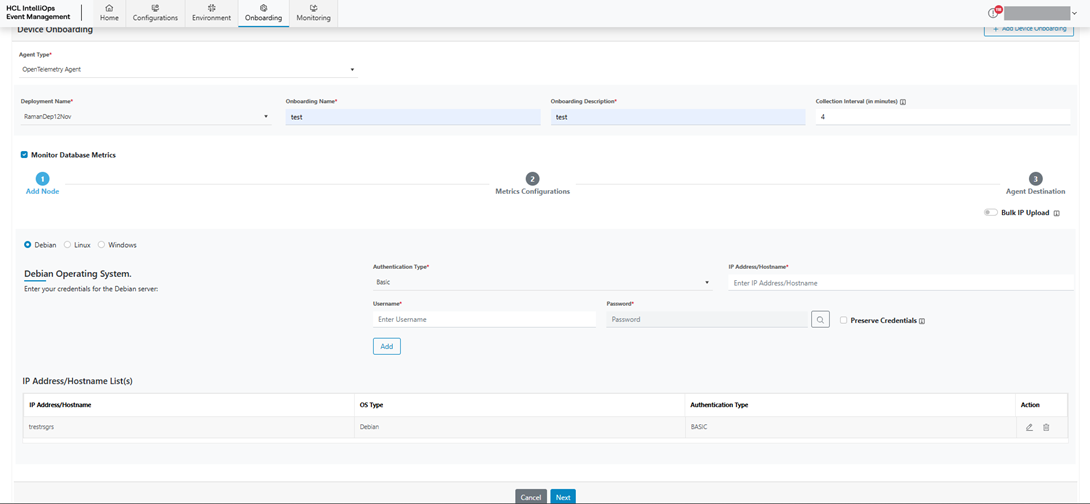 Note:All fields marked with an asterisk (*) are mandatory.
Database Configuration
A Monitor Database Metrics tab appears (If user has selected the Monitoring Database checkbox of previous screen)
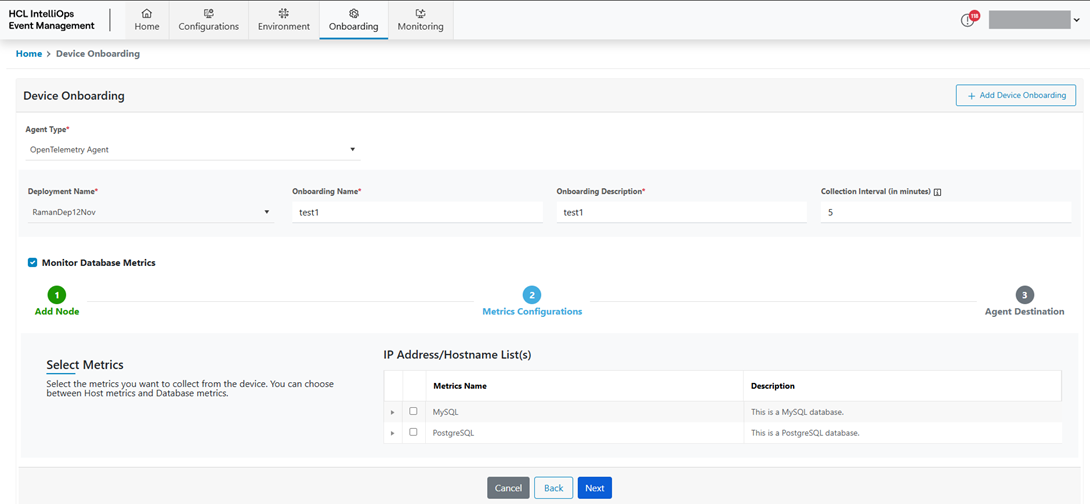
- Select the metric from the list and provide the nested details.
- For example user wants to collect the data for MySQL, then select the checkbox before MySQL option and then provide following details:
- Enter IP Address/Hostname
- Enter Username
- Enter Password. To enter the API password, follow the below-mentioned steps:
- Click on (
 ) icon.
 - Credentials popup will open
- Now Select the Input Type:
- Input Text – To enter the credential manually.
- Enter the secret information in Password field.
- Click on Save button.
- Click on (
- Select Deployment Environment (Container/Host, representing the Database is hosted on Container or Host)
- Click Next, Device Destination screen will appear.
Figure 5. IP Address/Hostname 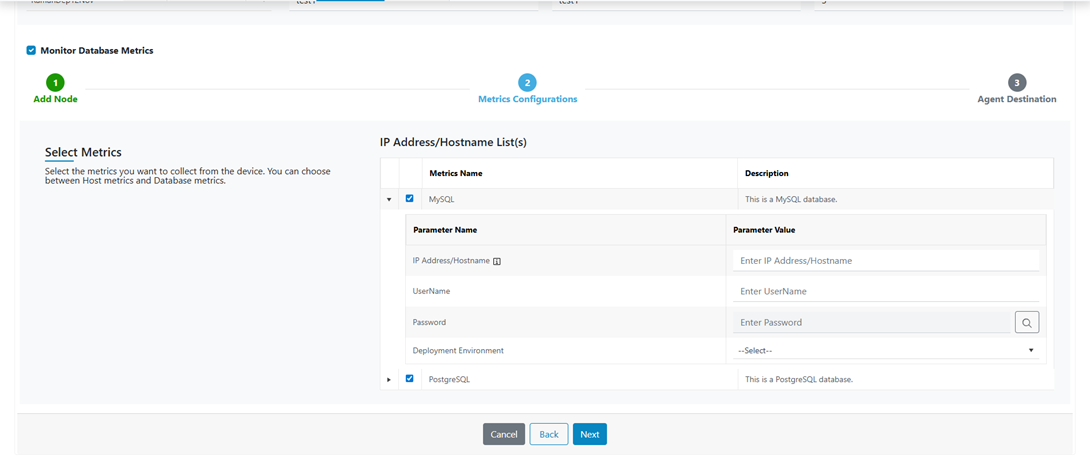
Device Destination Screen
The Device Destination screen allows users to configure the endpoint for the Agent—that is, where the Agent sends its data. Currently, there are two out-of-the-box options available, including Kafka Topics and the NiFi OTel Adapter. Below are the steps to configure:
- In the Device Destination drop-down, select a device destination. For example: Apache Kafka
- Once the destination is selected, the corresponding fields are displayed.
- The following fields are displayed when Apache Kafka is selected as the
device destination:
Table 2. Device Destination Field Fields Description Broker This field contains the name or address of the Kafka broker. Topic Name This field contains the Kafka topic name where metrics will be published. Group Id This field contains the Kafka consumer group ID. - Enter Broker Name.
- Enter Topic Name.
- Enter Group Id.
Figure 6. Select Device Destination 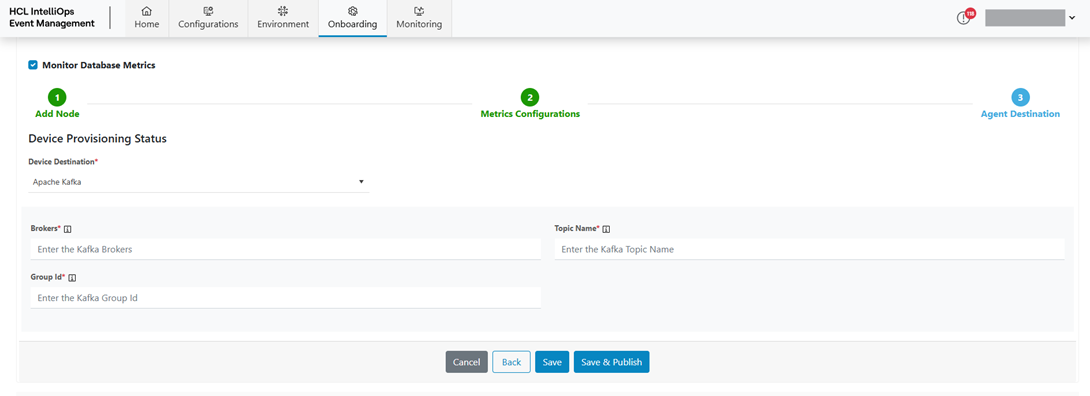
- Click on the Save button to save the configuration.
- Click Save & Publish to save and activate the configuration.
- Click Back to return to the previous page.
- Click Cancel to discard the changes.
Figure 7. Device On boarding Saved Successfully 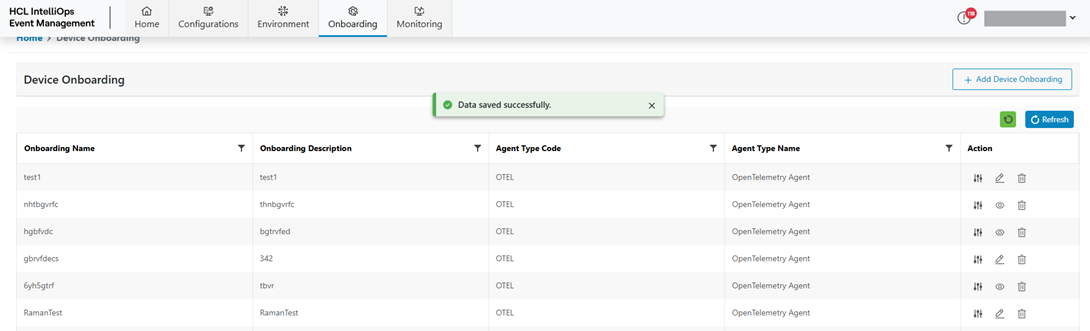
Detail Device Onboarding View
To view the details of a device onboarding, the user needs to follow the steps below:
- Click Details corresponding to the device onboarding to view its
details.
Figure 8. Device On boarding table 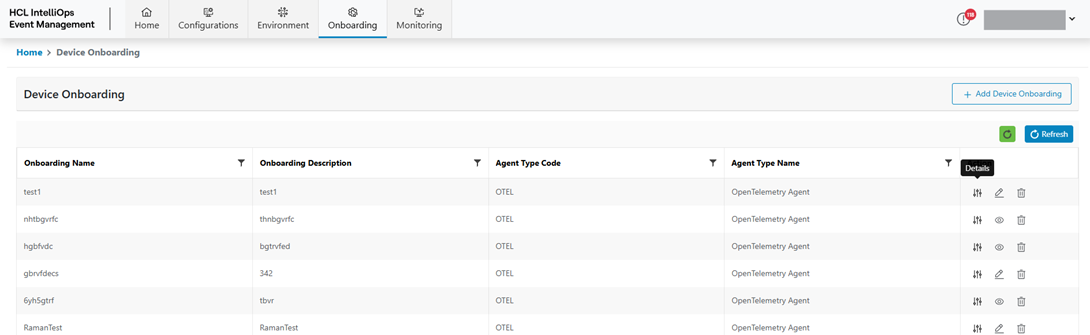
- The Details page displays the following information:
- Lists the IP addresses associated with the device onboarding.
- Each IP address can be expanded to view additional information.
- Displays the current status of the device onboarding (for
example, Draft).
Figure 9. IP Address Details Table 
Edit Device Onboarding
The edit option is only available when user has save the record. That mean user had not published.
To Edit/ Modify the information of an existing Device Onboarding, user needs to follow the below steps:
- On the main screen, click Onboarding then select Device Onboarding from the sub-menu.
- Available Device Onboarding list is shown in tabular view.
Figure 10. Edit Device Onboarding 
- Click Edit (
 ) corresponding to the Device Onboarding to be
updated.
) corresponding to the Device Onboarding to be
updated. - Modify the details as required and click Update.
Figure 11. Edit Device Onboarding (Cont.) 
- A success message appears on the screen.
Figure 12. Device Onboarding Updated Successfully 
Delete Device Onboarding
- On the main screen, click Onboarding then select Device Onboarding from the sub-menu.
- Available Device Onboarding list will be shown in a tabular view.
Figure 13. Delete Device Onboarding 
- Click Delete (
 ) icon.
 Figure 14. Delete Device Onboarding (Cont.) 
- Click on Confirm.
- The success message appears on the screen.
Figure 15. Success Message 
View Device Onboarding
To View the information of an existing Device Onboarding, user needs to follow the below steps:
- On the main screen, click Onboarding then select Device Onboarding from the sub-menu.
- Available Device Onboarding list is shown in tabular view.
Figure 16. View 
- Click the View (👁️) icon corresponding to the Device Onboarding you want to view.
- The details of the selected Device Onboarding are displayed.
Figure 17. View Detail 