End User View
BigFix Runbook AI allows users to trigger Runbook for unresolved/open tickets based on system driven recommendations and can even take actions on its own via supervised learning driven confidence scoring mechanism. It also keeps a log of the archived tickets resolved by BigFix Runbook AI for governance and auditing purposes. For evaluating its own performance, it also provides a dashboard to let users view key performance indicators and metrics briefly.
Additionally, it also provides a self-service driven mechanism to help users in identifying the automation potential, by ingesting and analyzing the ticket data from the ITSM system.
The user interface comprises of four main menus:
-
Tickets: Enables the users to view unresolved tickets and act. Based on confidence
score levels, BigFix Runbook AI can also trigger the executions automatically without any
manual intervention.
Figure 1. Actionable Tickets 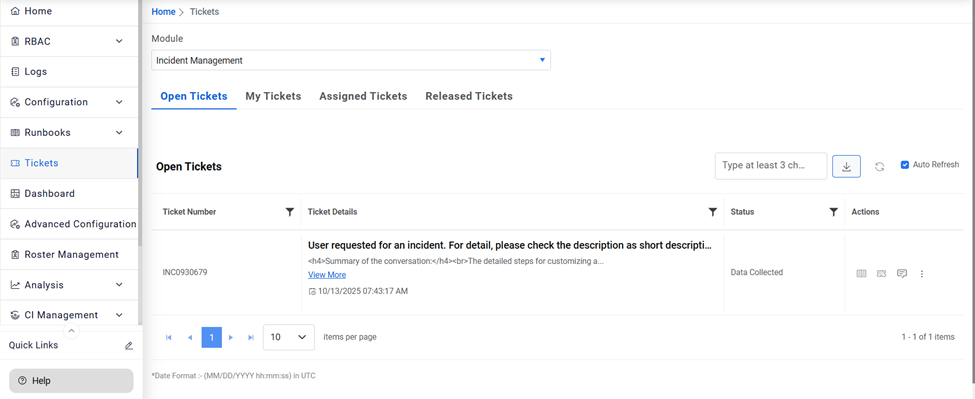
-
Ticket Logs : Provides users with a comprehensive log of all the activities for a
ticket, including updates and notifications.
Figure 2. Ticket Logs 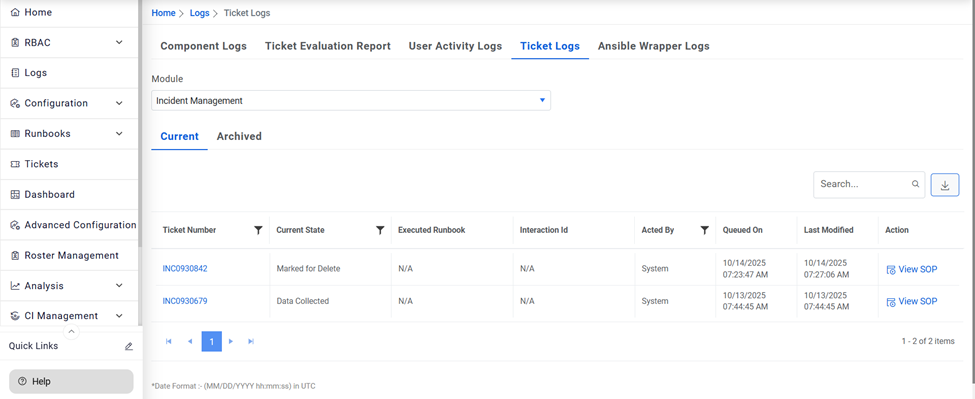
-
Knowledge : Enables users to search across the organization’s internal repositories
such as SNOW and external domains such as Stack Overflow and Ubuntu.org. Users can also
perform an advanced search by applying conditions followed by the search term and Boolean
condition (OR, AND, and so on) for more refined results.
Figure 3. Knowledge Search 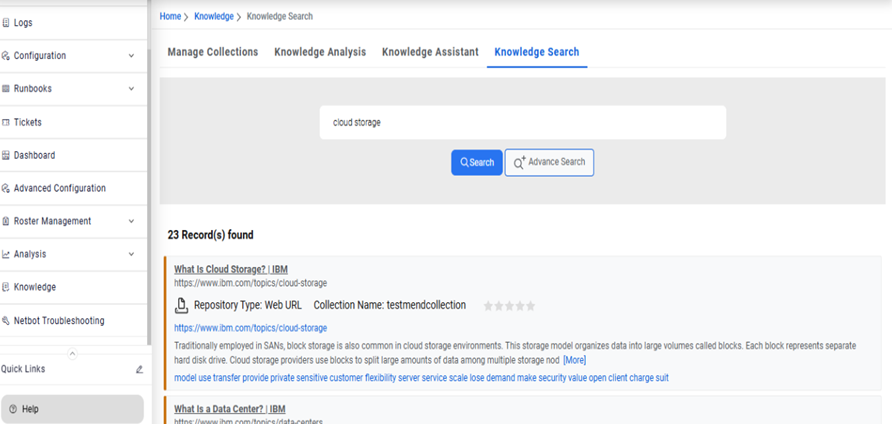
-
Dashboard: Provides a complete view of the environment and helps spot trends in
real-time. Each Dashboard User Interface (UI) element can instantly provide additional data
insights, including a platform to create reports using the preconfigured widgets available
on the dashboard.
Figure 4. Dashboard 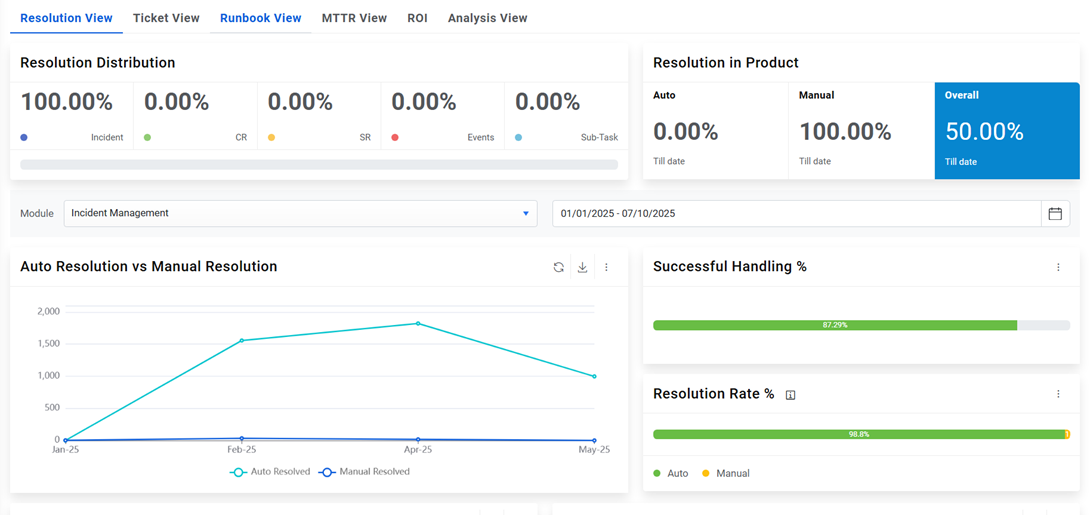
Figure 5. Dashboard (Cont.) 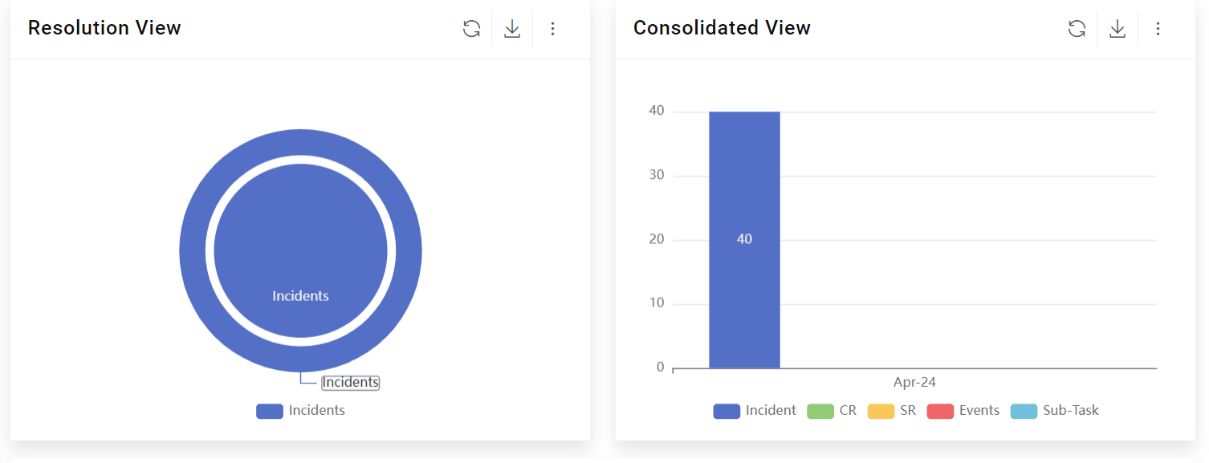
Additionally, end users also have access to a separate SaaS based, self-service driven Ticket Analysis module which can help them in identifying the automation potential. It comprises of two main menus:
-
Analysis: Enables user to create a new analysis and upload the ticket related data in
the predefined format. Also, all the analysis done in the past is available for reference
via this menu.
Figure 6. Analysis 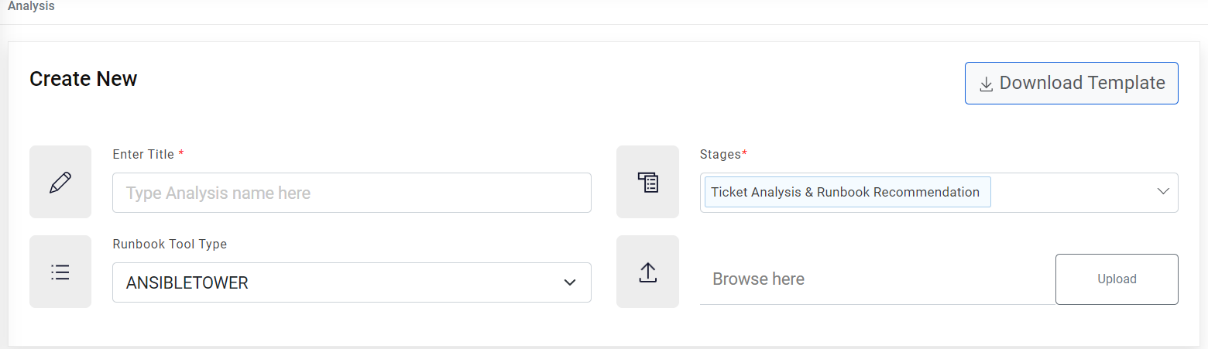
-
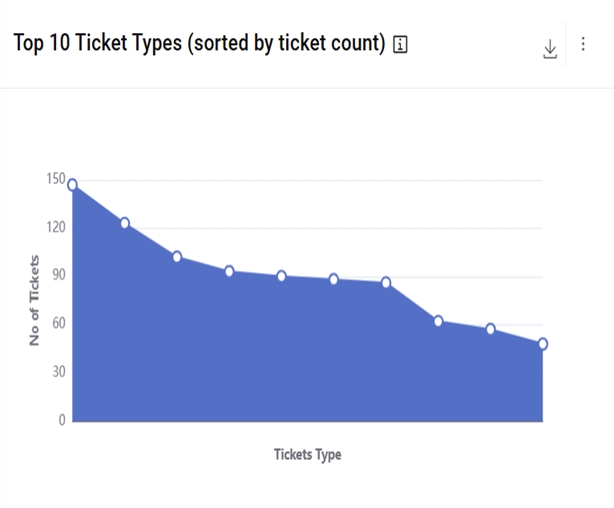
Dashboard: Provides a complete view of the ticket analysis including Top 10 use
cases, Runbook Available, Knowledge Articles available, Scripts Available, Ticket Categories
(Buckets), and many more.
Figure 7. Analysis Dashboard 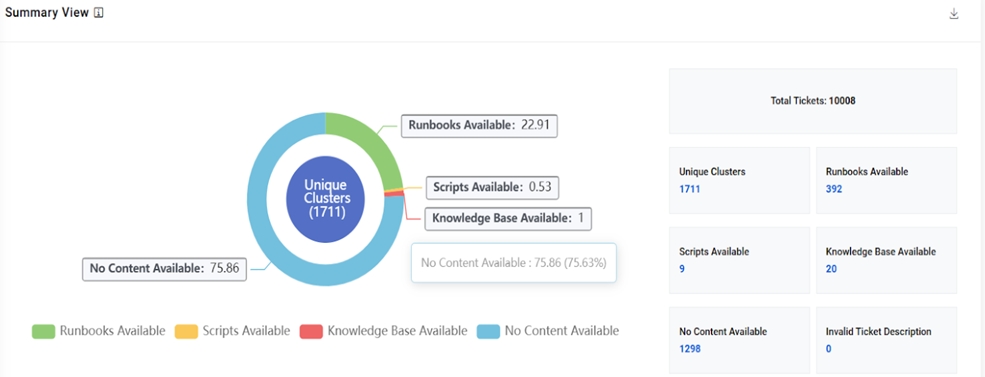
Figure 8. Analysis Dashboard (cont.)