Generating State of the sprint report
The State of the Sprint Report page displays all the sprints with related work items for a value stream selected as the output for the report execution.
Before you begin
Before you generate the State of the sprint report, you must install and integrate Handlebars Reporter plugin with DevOps Velocity. For more information, see Handlebars Reporter plugin documentation.
About this task
The State of the Sprint Report page provides comprehensive details of all active and inactive sprints for a selected value stream. All issues are aggregated by sprint and grouped according to the stage position of the items in the value stream. Current sprints are identified as Active, while past and future sprints are identified as Inactive on the State of the Sprint Report page. For a given sprint in a value stream, data represented in the report includes the following:
- Start, end, and completed dates
- Total number of issues
- Percentage of issues completed
- Number of story points planned
- Number of story points completed
- Number of unpointed issues
- Number of contributors
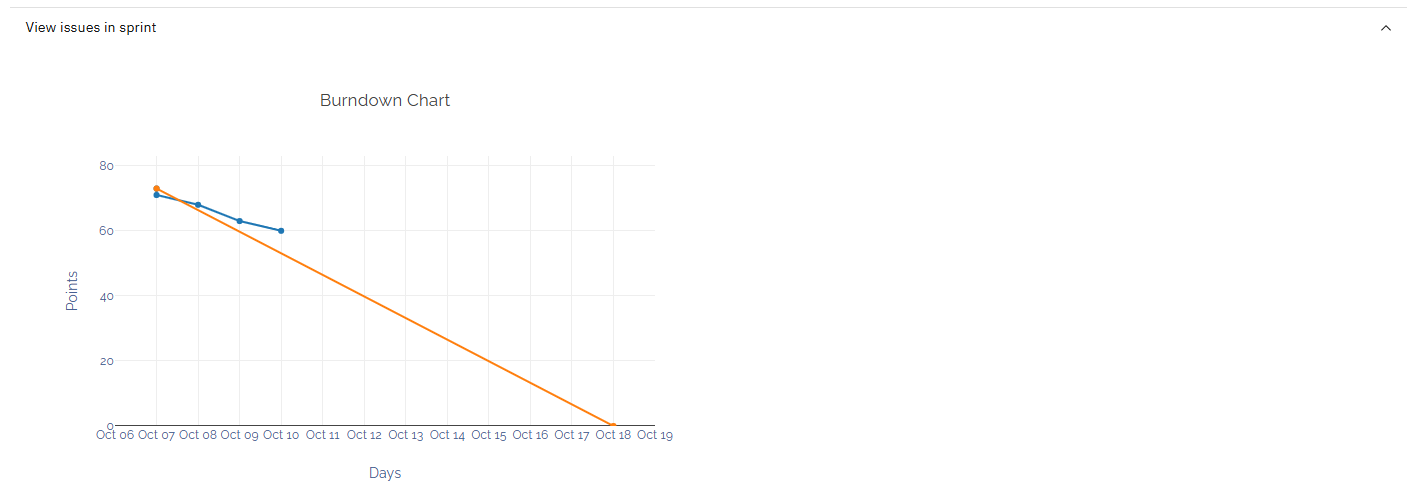
- Sprint burndown chart
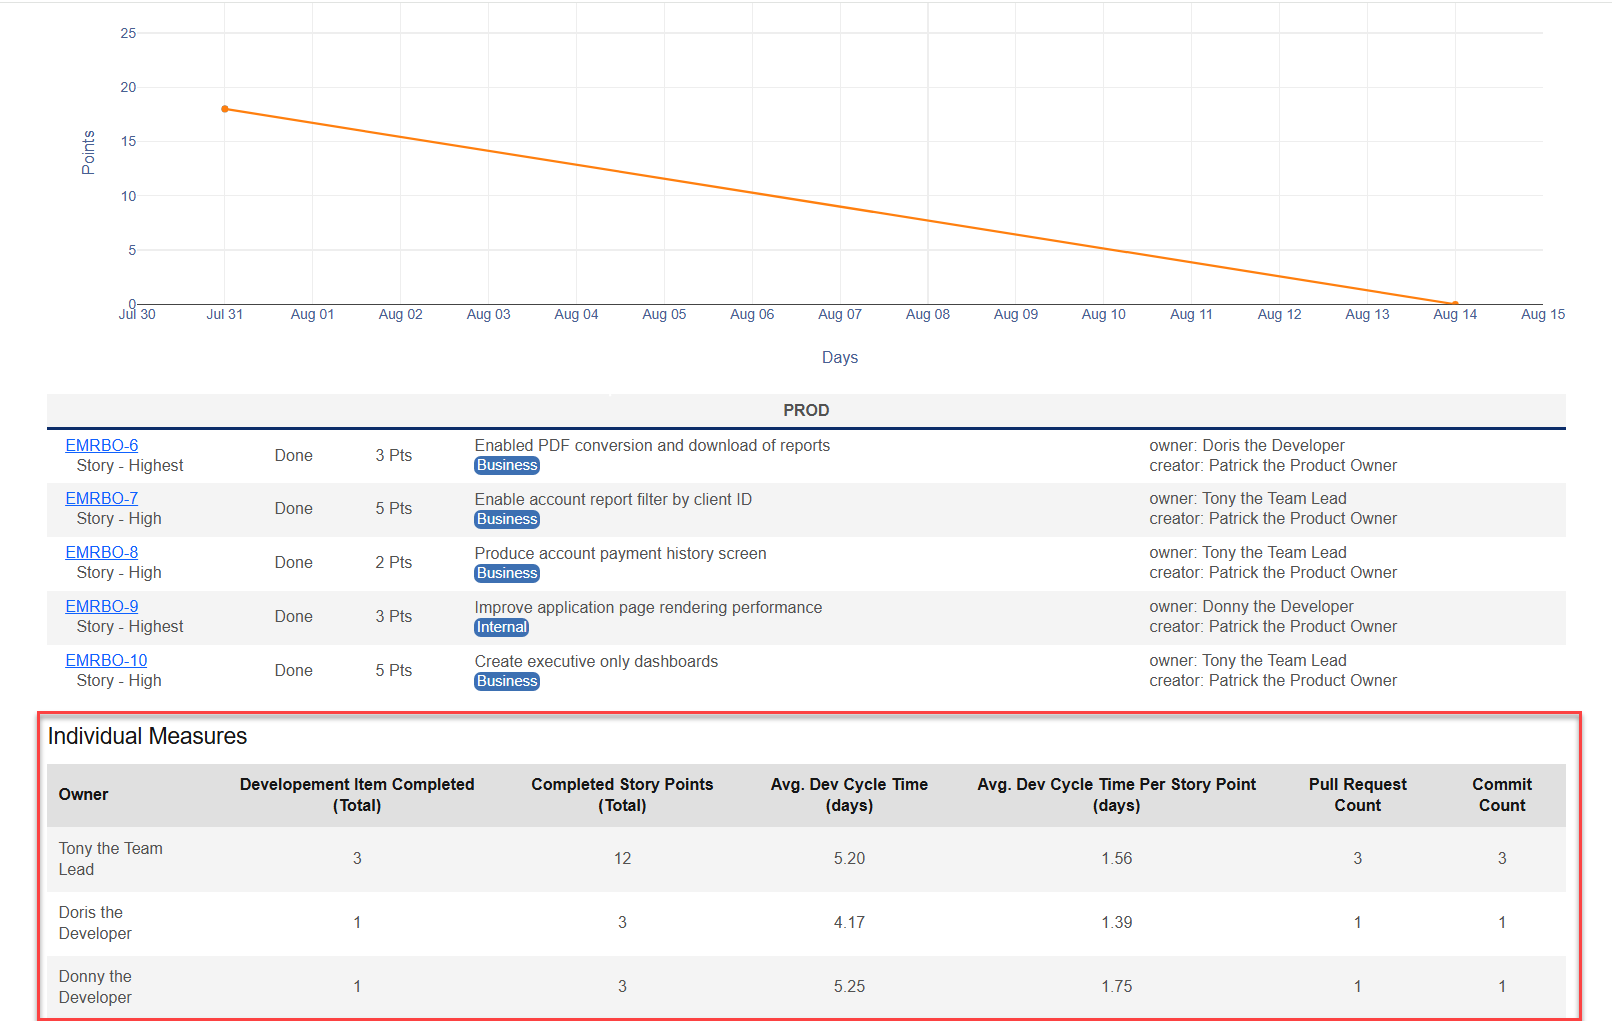
- Individual Measures
Additionally, Pointed vs Not Pointed and Planned vs Done (Release) bar chart graphs for all sprints in the value stream are displayed at the top of the State of the Sprint Report page.
Procedure
- Click .
-
Select the State of the Sprint field under the
Report Templates heading on the left side of the
page.
Note:When the State of the Sprint field is selected, a vertical blue bar is displayed on the left side of the field to indicate that it is the report to run.
- Click Run Report to open the RUN REPORT window.
-
Select the required Value Stream from the list.
Note:To set a value stream as default, click Set as Default.
-
Based on the selected Value Stream, review the
Sprints field, which selects the latest 10 sprints by
default. Add or remove sprints in the Sprints field to
generate the report.
The Sprints field value is mandatory to generate the report. You must select at least one sprint to generate the report.
- Click Confirm to run the report.
Results
The State of the Sprint Report page displays the following information about the report:
- Date: Shows the date, time, and email address of the user who ran the report.
- Status: Shows the color-coded status: Orange = STARTED, green = COMPLETE, and red = FAILED.
The following elements provide detailed information about the report:
- View log: When you click View log, the log details of the report are displayed.
- View parameters: When you click View parameters, the VIEW PARAMETERS OF EXECUTION window opens and displays the details used to run the report.
- Share: When you click Share, the URL is copied so you can share the report.
- Results: When you click Results, the State of the Sprint Report page is displayed.
A sample State of the Sprint Report page is shown below.
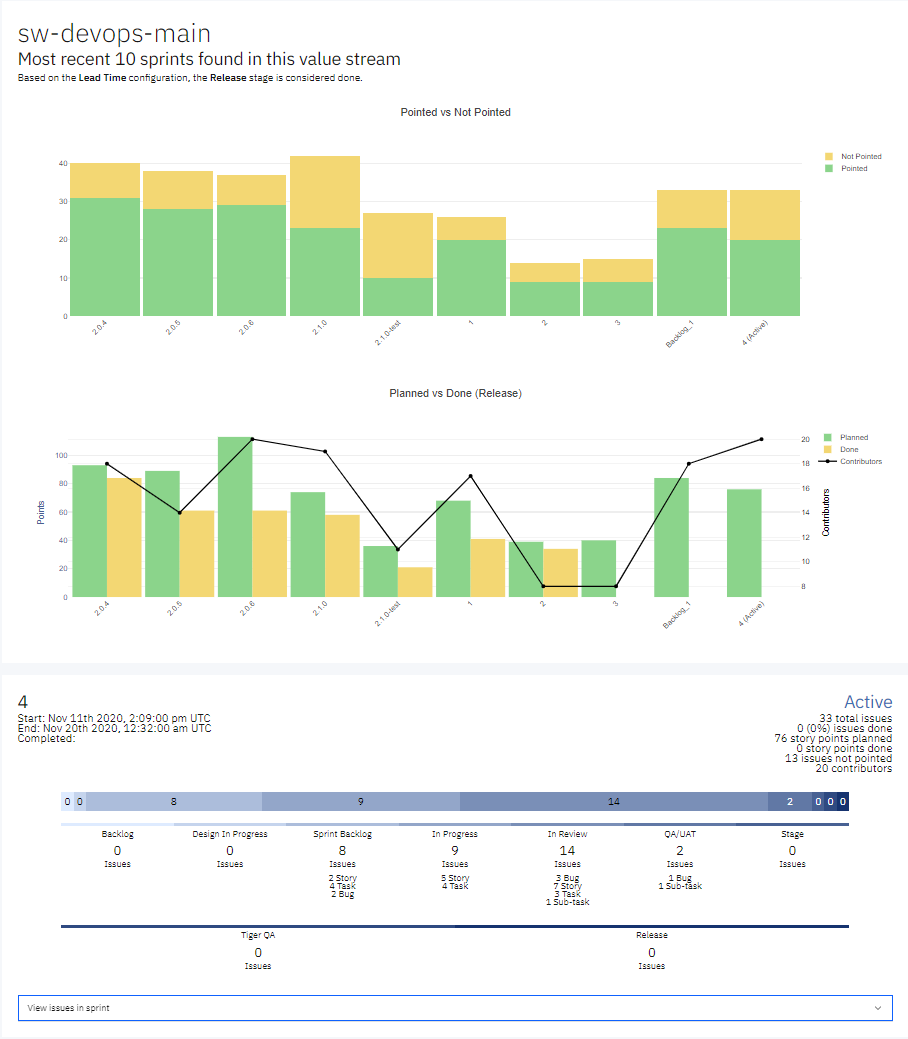
The Pointed vs Not Pointed and Planned vs Done bar charts are interactive. You can hover over any area of the chart to dynamically display values and plot tool icons that provide extended functionality. You can click different areas of the blue shaded bar chart above to display the stage name with the number of related issues.
Click View issues in sprint to expand and display the burndown chart, related issues for each stage of the value stream, and the individual measures for the developers who contributed to the sprint.
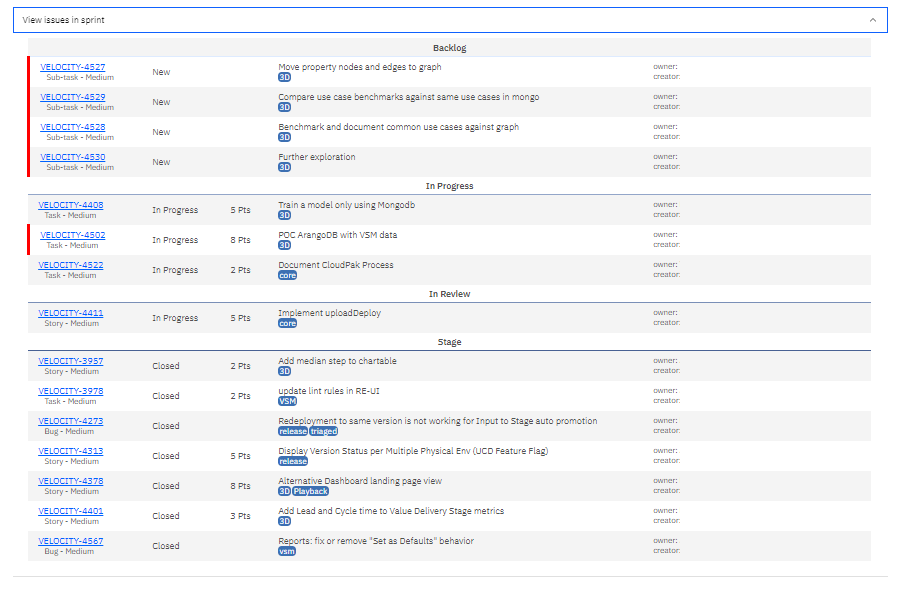
The red vertical bar indicates alerts for issues such as over median time, no owner, and so on. You can click the issue link to open the ticket in a browser window to view detailed information for that item.
Individual Measures
The Individual Metrics section, available for each sprint, provides detailed insights into the contributions and performance of each contributor. This data is critical for engineering managers, product owners, and team leads to assess individual efficiency, promote accountability, and guide continuous improvement initiatives.
For every contributor who participated during a sprint, the following metrics are displayed:
- Number of Issues Completed
Tracks the number of tasks (stories, bugs, or technical items) a contributor has completed. This metric helps evaluate task throughput and individual contribution levels.
- Total Story Points Completed
Measures the total effort delivered by a contributor based on the story points assigned to completed work items. This metric supports capacity planning and performance evaluation.
- Number of Pull Requests Created
Indicates the frequency at which a contributor submits code changes for review. This metric provides insight into coding activity and collaboration with peers.
- Total Number of Commits
Shows the number of code commits made by a contributor, reflecting consistency, development cadence, and active involvement in coding tasks.
- Dev Cycle Time
Measures the duration a contributor takes to complete a work item, calculated based on the specific stages you have configured for Dev Cycle Time within your value stream. This metric is useful for identifying delays, inefficiencies, or areas requiring support or process refinement.
- Dev Cycle Time per Story Point
Normalizes Dev Cycle Time by story point size, allowing teams to evaluate individual efficiency relative to task complexity. This metric helps identify high-performing contributors or flag potential mismatches between estimated and actual effort.
Individual Measures are displayed in a tabular format within the State of the Sprint report, as shown in the following example, offering a clear overview of the contributions and performance metrics of each contributor for a given sprint.