Flow Efficiency metric
The Flow Efficiency metric is the ratio of actual development time to cycle time. It is expressed as a percentage, which helps teams to understand their performance. A higher flow efficiency indicates a smoother process with fewer delays, while lower values indicate inefficiencies that might require attention to identify and eliminate bottlenecks in the workflow.
The Flow Efficiency metric is a key metric used to assess the reliability and success of the changes deployed within a system. This metric provides insight into the efficiency of work in the development pipeline. By using the Flow Efficiency metric, teams can create a more predictable and effective delivery process. Therefore, you can get better-quality results and increased delivery efficiency.
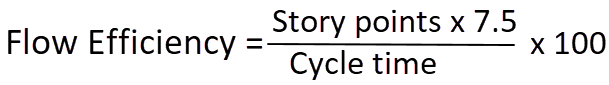
HCL DevOps Velocity (Velocity) calculates the Flow Efficiency metric by using the following formula:
Where:
Story points: The total value of the story points of the issues.
Cycle time: The total time taken for each issue to progress from start to completion.
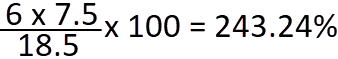
Here is an example of the calculation:
A work item had 6 story points, and the cycle time was 18.5.
Therefore, the Flow Efficiency metric is calculated as follows:
Display of the Flow Efficiency metric in Velocity
In Velocity, the Flow Efficiency metric is displayed on the Dashboards and Value Streams pages:
- Dashboards page: The Flow Efficiency metric is displayed in the Dashboards by using a graph, which dynamically shows flow efficiency data in percentage over time. You can group by days, month, week, quarter, year, or with custom dates.
- Value Streams page: The Value
Streams page shows the Flow Efficiency metric in a specific
value stream. It shows the ratio of actual development time over the cycle time
in percentage by taking the number of overall work items in the value stream in
the last 30 days.
The result is presented on the Value Streams page, which enables stakeholders to view the overall stability and reliability of the deployment process for that specific value stream.
Adding the Flow Efficiency metric in the value stream
- On the Home page, click .
The value stream page is displayed.
- On the Value Streams page, click
 to display the metric bar.
 - Click
 to display the Add Metrics
window.
to display the Add Metrics
window. - In the Delivery Flow category, click
 for the Flow Efficiency
metric.
for the Flow Efficiency
metric. The Flow Efficiency metric is displayed in the Metrics bar on the value stream page.
Adding the Flow Efficiency metric chart to the Dashboard
- Click .
- Perform any of the following steps:
- Click any existing dashboard to open the dashboard.
- Click Add new dashboard, provide the name and description for the dashboard, and then click Add.
The Dashboard is opened.
- Click Add charts and in the Delivery
Flow category, click Add for the
Flow Efficiency metric.
The chart is displayed on the dashboard.