Viewing resource monitoring usage data
After you add and configure monitoring sources in the HCL OneTest™ Server project, you can view the resource monitoring usage data in a graph for each monitored source and for each selected counter.
Before you begin
- Added and connected a monitoring source, and an agent when required, to your project to be able to view the list of available sources and agents, and the resource monitoring usage data in your project.
- Configured a test with advanced parameters to view persistent usage data in a graph.
About this task
After you add a monitoring source to HCL OneTest™ Server, configure the source and select monitoring counters, you can view the current resource monitoring usage data for each selected counter in a graph. If you configure the test to collect data, you can also view the resource monitoring usage data that is collected for a defined timeframe. In this case, the data is still visible in the graph three minutes after the test run is complete. After this time, you can create queries to retrieve the data.
Procedure
-
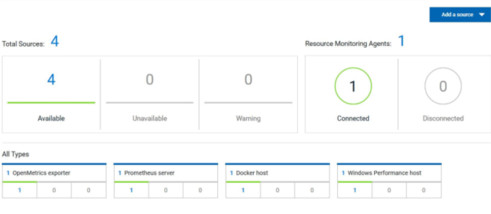
Click a link either in the Total Sources cards or in the
All Types cards from the resource monitoring page to
access the resource monitoring usage data.
The tables display the total number of sources in your project and the number of sources by type. You can also view the number of available and unavailable sources, and the number of sources that contain warnings. If you have added '4' sources to your project, for example, click '4' in the table to access the page where you can see the resource usage data for each source.
If you have added agents to your project, you can also view the number of agents that are connected and disconnected to your project.
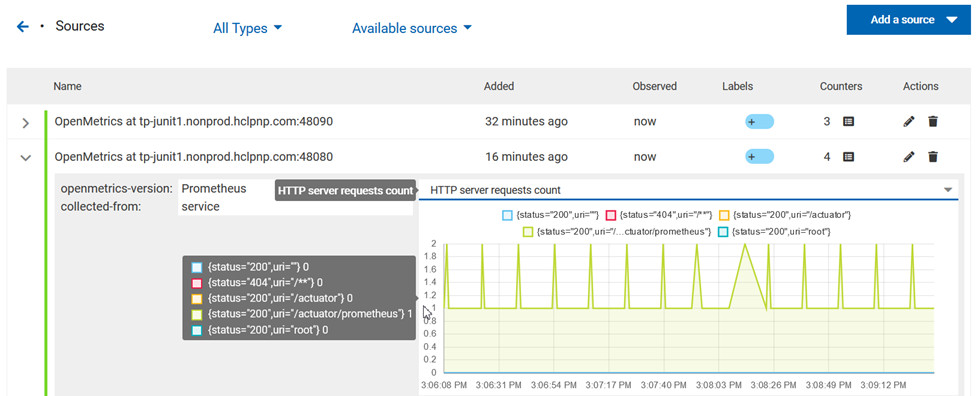
 The list of sources is displayed in a new page.
You can filter the list of sources by collector type or by status.
- Expand a monitoring source under the Name column to see the current monitoring data usage in a graph.
-
Click the down arrow
 to select a counter in the list.
A graph is displayed for each counter.
