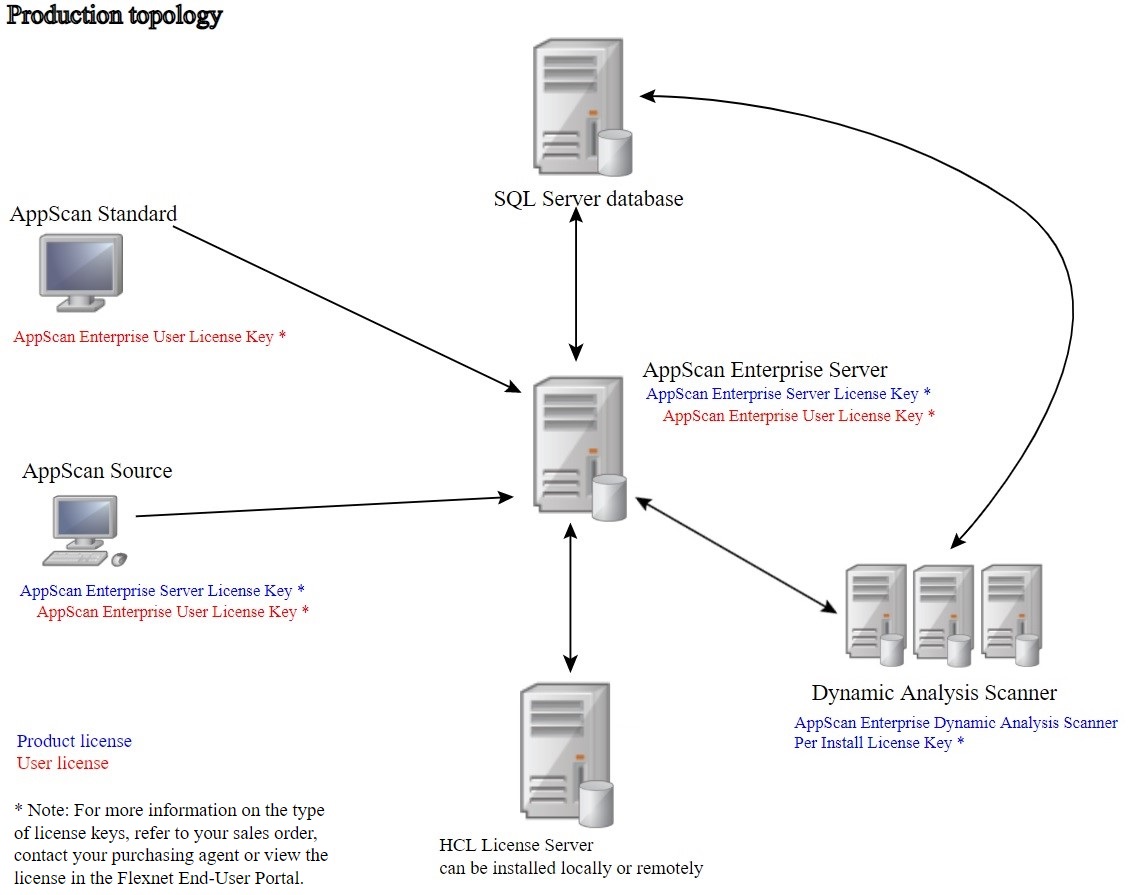
Production topology example
This enterprise topology example is useful for production or medium-sized teams and multiple server deployments. In this type of installation, databases are installed on a single database server and each application is installed on a dedicated application server. You can install multiple instances of an application on separate application servers.
Improved traffic performance for DAST scanning
As of AppScan® Enterprise version 10.7.0, scan data is now written into a local built-in database on the DAST scan server. At the end of the scan, data is transferred to the central SQL Server database which resides on the AppScan® Enterprise Server. The increase in network traffic between the scan server and the target application reduces the network bandwidth between the scan server and the database. This improves the performance of the Web UI, enables organizations to run more simultaneous scans on a single scan server, and addresses the latency concerns when the scan server is located far from the database server.
Network traffic benchmarks for AppScan® Enterprise DAST scanning
The following benchmarks are based on a dynamic analysis scan of a test website 'Altoro Mutual' (demo.testfire.net). The test scan was completed by AppScan® Enterprise 10.7.0 in 47 minutes, covered 58 pages, and included 20,914 unique security tests.
- Operaring system: Windows™ Server 2016 Standard
- CPU: 8 cores
- RAM: 16 GB
- Operaring system: Windows™ Server 2016 Standard
- Database server: Microsoft™ SQL Server 2019 (RTM), version 15.0.2000.5 (x64)
- CPU: 20 cores
- RAM: 64 GB
- Operaring system: Windows™ Server 2016 Standard
- Virtual machines: 10 VMs with varying configurations
| Agent | CPU (cores) | Memory (GB) |
|---|---|---|
| Agent 1 | 2 | 4 |
| Agent 2 | 6 | 8 |
| Agent 3 | 8 | 16 |
| Agent 4 | 14 | 20 |
| Agent 5 | 20 | 20 |
| Agent 6 | 22 | 22 |
| Agent 7 | 25 | 24 |
| Agent 8 | 25 | 24 |
| Agent 9 | 25 | 24 |
| Agent 10 | 25 | 24 |
| Server | Total bytes (GB) | Bytes sent (GB) | MB/second sent | Bytes received (GB) | MB/second received |
|---|---|---|---|---|---|
| SQL Database Server | 241.65 | 156.15 | 34.7 | 85.5 | 19 |
| DAST Scan Server | 42.36 | 11.25 | 3.2 | 31.11 | 8.85 |
| Web Server | 496.8 | 327.15 | 72.7 | 169.65 | 37.7 |