
OpenTelemetry plugin for AppScan 360°
A central telemetry gateway that automatically collects logs and metrics from all application services and routes each signal to the right monitoring backend.
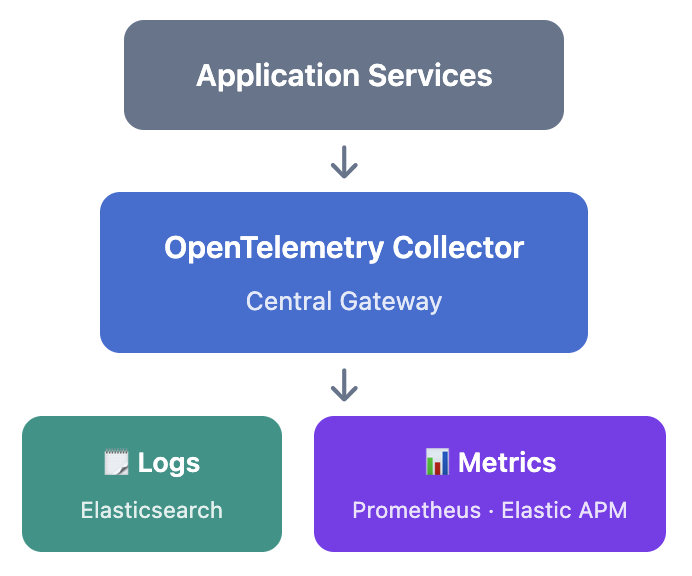
Components
| Component | Function | Version |
|---|---|---|
| OpenTelemetry Operator | Manages the lifecycle of collector instances inside Kubernetes. | 0.120.0 |
| OpenTelemetry Collector | The actual gateway that receives and routes telemetry data. | 0.165.0 |
Data management
- Logs
Routed to Elasticsearch (ECK). Automatically organized into named data streams based on log type and environment.
- Metrics
Sent to Prometheus and Elastic APM Server for dashboards and alerting.
- Log routing example
A service tagging logs with
log.type=auditand environment=stagingwill land in thelogs-asoc-audit-stagingdata stream automatically.
Connecting services
opentelemetry-collector.opentelemetry-collector.svc.cluster.local:4317log.typeFor example:auditapp
deployment.environmentFor example:stagingproduction
Installation
Both components — the Operator and the Collector — can be installed using the official Helm charts from the OpenTelemetry project, or any other installation method your team prefers (Argo CD, Flux, plain manifests, and so on).
Charts are available at open-telemetry.github.io/opentelemetry-helm-charts.