TimeSeries Analysis
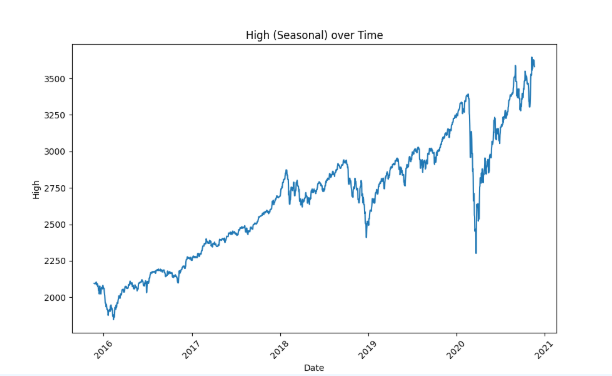
This component analyzes time series data to identify trends, seasonality, and anomalies, and presents the results through visualizations such as line plots, moving averages, and seasonal decomposition.
This component analyzes time series data to identify trends, seasonality, and anomalies, and presents the results through visualizations such as line plots, moving averages, and seasonal decomposition.