Alert definitions
See all the alerts defined in AIDA. Pause one or more alerts immediately.
Before you begin
Each alert definition is based on a trigger, a specific set of conditions: the amount of consecutive anomalies during a specific time interval.
For example,10 anomalous data points falling outside the expected range of values within 1 hour.
- Continuous: Triggers when anomalous data points fall above or below the predicted range.
- Total: Triggers for anomalous data points that are either above or below the predicted range, as well as those that exceed both thresholds.
[
    {
    "definitionID": "CONTINUOUS_JOBWKS",
    "name": "Continuous anomalies for jobs in plan by workstation",
    "kpi": "application_wa_JobsByWorkstation_jobs",
    "trigger":{
                "type": "continuous",
                "value": 10,
                "timeFrame": 60,
                "description": "Over 10 Consecutive  Anomalies within 1 hour"
               },
    "periodicity": "1 hour",
    "isActive": "true"
    },

   {
    "definitionID": "TOTAL_JOBWKS",
    "name": "Total Anomalies for Jobs in plan by Workstation",
    "kpi": "application_wa_JobsByWorkstation_jobs",
    "trigger":{
                "type": "total",
                "value": 3,
                "timeFrame": 60,
                "description": "Over 3 Anomalies within 1 hour"
               },
    "periodicity": "1 hour",
    "isActive": "false"
    },
    {
    "definitionID": "CONTINUOUS_JOBFOLDER",
    "name": "Continuous Anomalies Jobs in plan by Folder",
    "kpi": "application_wa_JobsByFolder_jobs",
    "trigger":{
                "type": "continuous",
                "value": 10,
                "timeFrame": 60,
                "description": "Over 10 Consecutive  Anomalies within 1 hour"
               },
    "periodicity": "1 hour",
    "isActive": "true"
    },

    {
    "definitionID": "TOTAL_JOBFOLDER",
    "name": "Total Anomalies for Jobs in plan by Folder",
    "kpi": "application_wa_JobsByFolder_jobs",
    "trigger":{
                "type": "total",
                "value": 3,
                "timeFrame": 60,
                "description": "Over 3 Anomalies within 1 hour"
               },
    "periodicity": "1 hour",
    "isActive": "false"
    },
    {
    "definitionID": "CONTINUOUS_JOBSTATUS",
    "name": "Continuous Anomalies for Jobs in plan by status",
    "kpi": "application_wa_JobsInPlanCount_job",
    "trigger":{
                "type": "continuous",
                "value": 10,
                "timeFrame": 60,
                "description": "Over 10 Consecutive  Anomalies within 1 hour"
               },
    "periodicity": "1 hour",
    "isActive": "true"
    },
    {
    "definitionID": "TOTAL_JOBSTATUS",
    "name": "Total Anomalies for jobs in plan by status",
    "kpi": "application_wa_JobsInPlanCount_job",
    "trigger":{
                "type": "total",
                "value": 3,
                "timeFrame": 60,
                "description": "Over 3 Anomalies within 1 hour"
               },
    "periodicity": "1 hour",
    "isActive": "false"
    },
    {
    "definitionID": "CONTINUOUS_JOBTOTAL",
    "name": "Continuous Anomalies for total jobs",
    "kpi": "application_wa_JobsInPlanCount_job_total",
    "trigger":{
                "type": "continuous",
                "value": 10,
                "timeFrame": 60,
                "description": "Over 10 Consecutive Anomalies within 1 hour"
               },
    "periodicity": "1 hour",
    "isActive": "true"
    },
    {
    "definitionID": "TOTAL_JOBTOTAL",
    "name": "Total Anomalies for total jobs",
    "kpi": "application_wa_JobsInPlanCount_job_total",
    "trigger":{
                "type": "total",
                "value": 3,
                "timeFrame": 60,
                "description": "Over 3 Anomalies within 1 hour"
               },
    "periodicity": "1 hour",
    "isActive": "false"
    },
    {
    "definitionID": "CONTINUOUS_JOBHISTORY",
    "name": "Continuous Anomalies for job history",
    "kpi": "job_history",
    "trigger":{
                "type": "continuous",
                "value": 2,
                "timeFrame": 2880,
                "description": "Over 10 Consecutive Anomalies within 2 days"
               },
    "periodicity": "1 hour",
    "isActive": "true"
    },
    {
    "definitionID": "TOTAL_JOBHISTORY",
    "name": "Total Anomalies for job history",
    "kpi": "job_history",
    "trigger":{
                "type": "total",
                "value": 2,
                "timeFrame": 2880,
                "description": "Over 3 Anomalies within 2 days"
               },
    "periodicity": "1 hour",
    "isActive": "false"
    },
    {
    "definitionID": "CONTINUOUS_MESSAGE",
    "name": "Continuous Anomalies for message files fill percentile",
    "kpi": "application_wa_msgFileFill_percent",
    "trigger":{
                "type": "continuous",
                "value": 10,
                "timeFrame": 60,
                "description": "Over 10 Consecutive Anomalies within 1 hour"
               },
    "periodicity": "1 hour",
    "isActive": "true"
    },
    {
    "definitionID": "TOTAL_MESSAGE",
    "name": "Total Anomalies for message files fill percentile",
    "kpi": "application_wa_msgFileFill_percent",
    "trigger":{
                "type": "total",
                "value": 3,
                "timeFrame": 60,
                "description": "Over 3 Anomalies within 1 hour"
               },
    "periodicity": "1 hour",
    "isActive": "false"
    },
{
        "definitionID": "CONTINUOUS_INCOMPLETEPREDECESSOR_CRITICAL",
        "name": "WA critical job incomplete predecessor",
        "kpi": "application_wa_criticalJob_incompletePredecessor_jobs",
        "trigger": {
            "type": "continuous",
            "value": 10,
            "timeFrame": 60,
            "description": "Over 10 Consecutive Anomalies within 1 hour"
        },
        "periodicity": "1 hour",
        "isActive": "true",
        "alert-definition": "CONTINUOUS"
    },
    {
        "definitionID": "TOTAL_INCOMPLETEPREDECESSOR_CRITICAL",
        "name": "WA critical job incomplete predecessor",
        "kpi": "application_wa_criticalJob_incompletePredecessor_jobs",
        "trigger": {
            "type": "total",
            "value": 10,
            "timeFrame": 60,
            "description": "Over 10 Anomalies within 1 hour"
        },
        "periodicity": "1 hour",
        "isActive": "true",
        "alert-definition": "TOTAL"
    }
]
About this task
From AIDA
left-hand sidebar, select Alert Definitions. 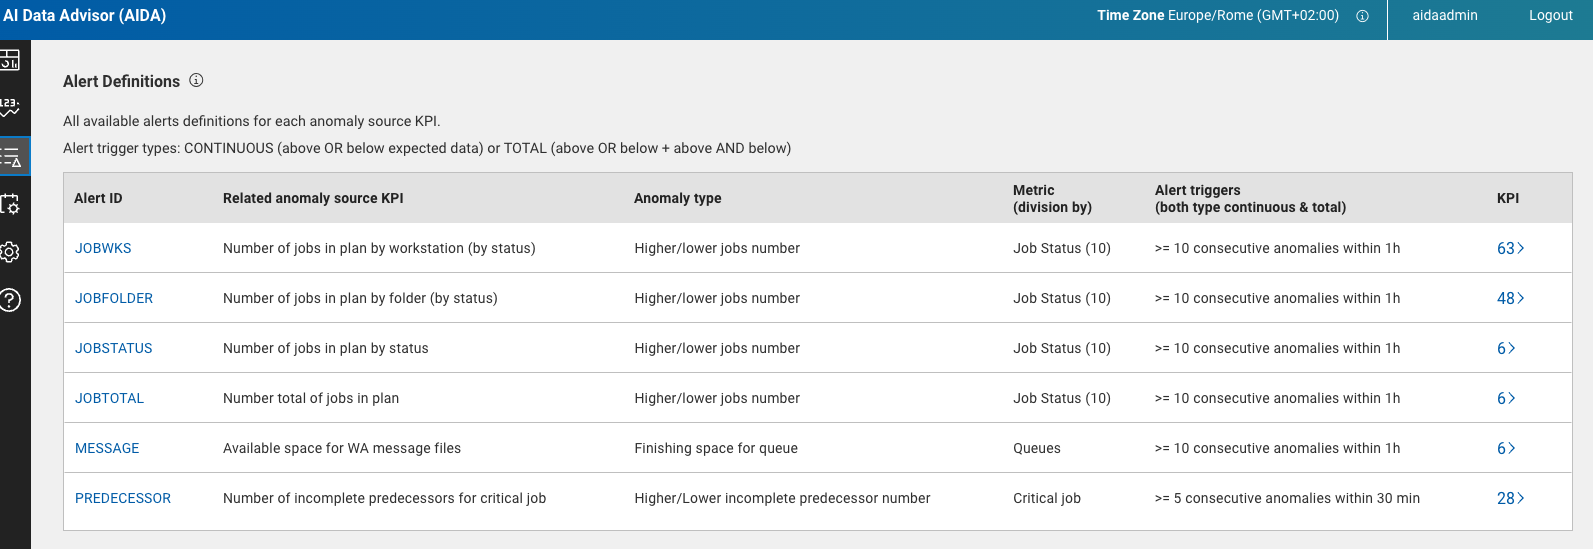
In this page you can view the full list of alert definitions in table format.
- Alert ID
- The ID of the alert definition.
- Anomaly Source KPI
- The KPIs that contribute to generate the alert.
- Anamoly type
- The type of anomaly that generates the alert (for example: a higher or lower amount of job than expected).
- Metric
- The sub-division criteria of the alert instances. Depending on the KPI, it can be job status, star time/duration or queue.
- Alert Trigger
- Set of conditions defining the alert. For example: Over 3 anomalies within 1 hour.
- KPI
- The number of KPIs defined by this alert definition.
Click on an alert definition row (or the icon on the right) to open a side panel displaying detailed information and a tabular list of all alerts organized by the KPIs specified in the alert definition.
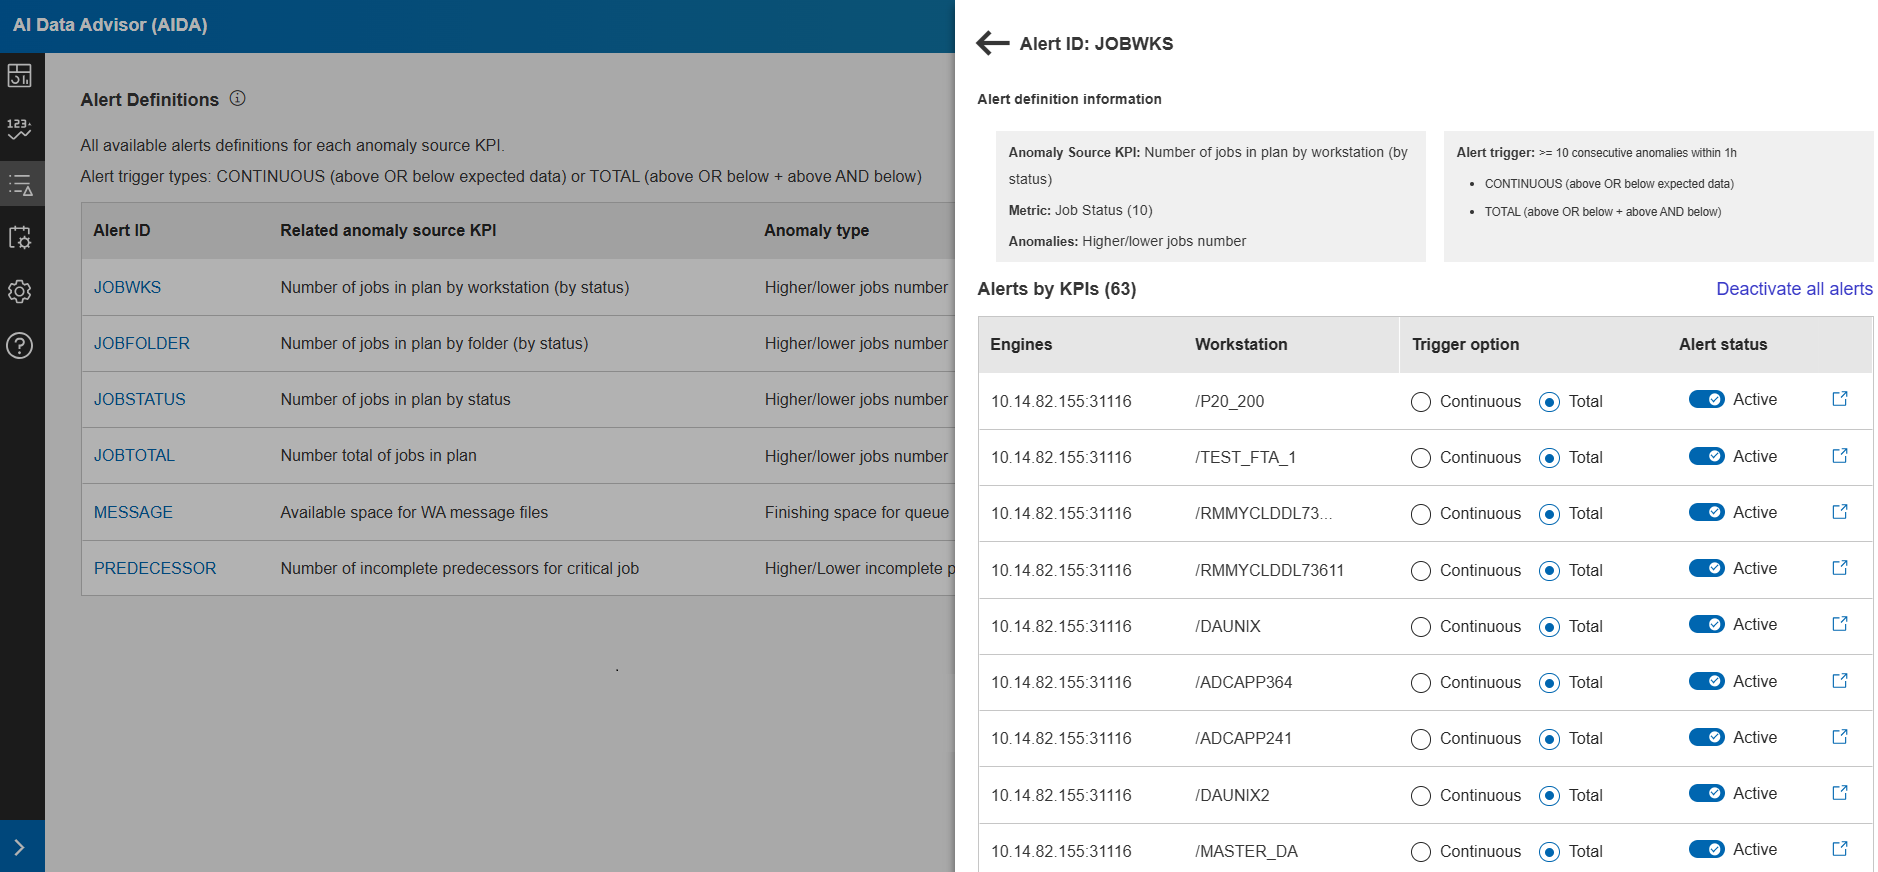
For each alert, you can modify the trigger type and activate or deactivate alert generation. A global option,Deactivate All Alerts, is also available to disable alert generation for all alerts in the list. Click the action icon on the right side of each row to access the Alert detail page, where you can view alert information, open alert instances, and the history for the past 12 months.
Customizing alert detection
Alert detection behavior can be customized to better adapt to the characteristics of the monitored environment and the frequency of data collection. By default, an alert is generated when 10 anomalous datapoints are detected within a 60‑minute time window. You can modify these thresholds to define alternative detection criteria, such as identifying 50 anomalous datapoints over a 120‑minute window.
Customizing alert thresholds is useful in environments where metric data is collected less frequently (for example, 4–5 datapoints per hour), as it helps prevent unstable or premature alerts.
Configuring anomaly tolerance
# Enable or disable tolerance-based anomaly detection
ANOMALY_USE_TOLERANCE=false

# Fixed absolute tolerance applied to yhat_upper/yhat_lower bounds
# Used only when ANOMALY_USE_TOLERANCE=true
ANOMALY_FIXED_TOLERANCE=0.5

# Percentage tolerance (0.01 = 1%) applied to the prediction range
# Used only when ANOMALY_USE_TOLERANCE=true
ANOMALY_PERCENTAGE_TOLERANCE=0.01
When tolerance is enabled, a datapoint is considered anomalous only if it exceeds the prediction bounds plus the configured fixed or percentage tolerance. This mechanism reduces sensitivity to minor metric fluctuations.
Controlling alert generation globally
# Global number of anomalous datapoints required to generate an alert.
# Leave empty to keep the value defined in each alert definition (trigger.value).
ALERT_ANOMALOUS_POINTS_REQUIRED=

# Global time window, in minutes, used to search for anomalous datapoints.
# Leave empty to keep the value defined in each alert definition (trigger.timeFrame).
ALERT_ANOMALY_RANGE_MINUTES=
If these properties are set, they are applied uniformly to all alert definitions. If left empty, alert detection behavior is determined by the configuration defined within each alert.
- Increase the number of required anomalous datapoints and the detection time window in environments with sparse or irregular metric collection.
- Retain default values when metrics are collected frequently and consistently.
- Combine tolerance settings with customized thresholds to reduce alert noise while preserving detection accuracy.