Publishing Domino statistics to New Relic
You can publish Domino statistics to New Relic, a third-party, web-based monitoring application. New Relic allows you to visually monitor statistics in real time on multiple Domino servers from one dashboard.
About this task
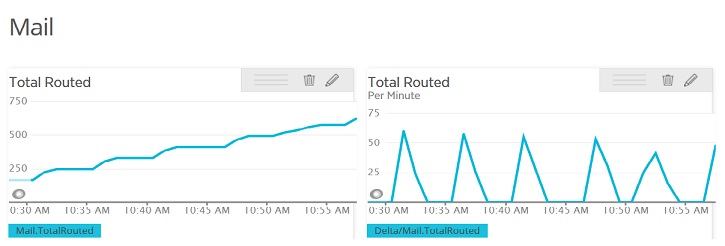
Domino statistics are reported through a New Relic plugin called DominoStats. All numeric Domino statistics are reported to New Relic. There is a default set of dashboard pages in the DominoStats plugin that include charts for Domino statistics that are commonly monitored. Statistics are published once a minute and are retained for 24 hours.
The DominoStats plugin is available with a free New Relic subscription. You can buy a paid subscription, in which case advanced New Relic features are available, such as alert notifications and custom dashboards.
To enable Domino statistics monitoring in New Relic:
Procedure
-
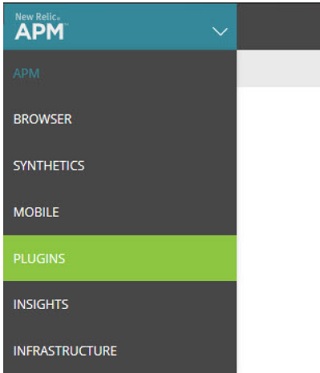
Wait a few minutes for the initial metrics to be published. Then, from New Relic, click
PLUGINS. This option is seen either at the top of the New Relic window or
from the APM menu:
Results
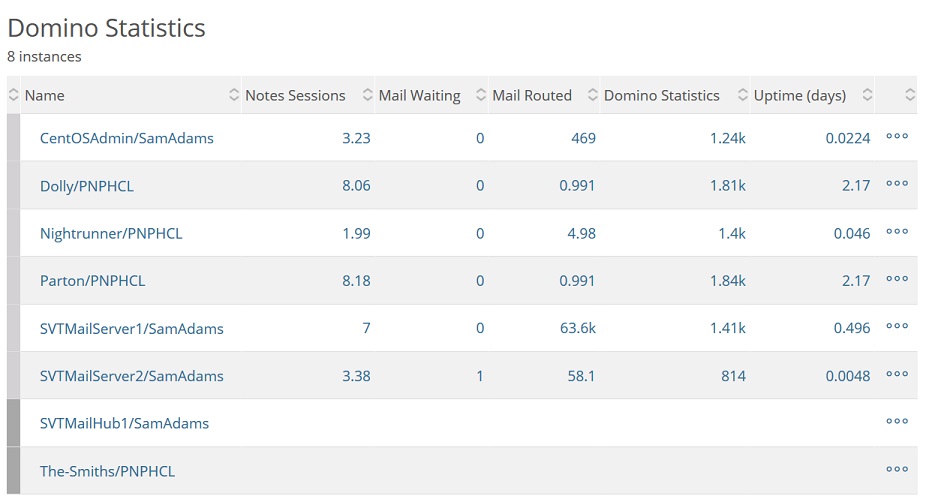
- Overview (commonly monitored statistics)
- Notes Server (Notes client transaction statistics)
- IMAP Server
- POP3 Server
- SMTP Server
- Directory
- Replication
- Traveler
- High Usage Views
- Repair
- Metric Publishing