Change Failure Rate metric
The Change Failure Rate (CFR) is the ratio of the number of failed changes to the total number of changes deployed within a specified time. It is expressed as a percentage, which helps teams to understand the rate at which their deployments are successful or failed.
The CFR is a key metric used to understand how the changes introduced in software are reliable. It calculates the percentage of changes that fail, which requires rollbacks, hotfixes, or other actions. As part of the DORA metrics, CFR measures the percentage of changes that need to be rolled back, fixed with a hotfix, or require other actions. This metric helps organizations to evaluate the stability of their deployment process.
Velocity calculates the CFR metric by using the following formula:

Where:
- Number of failed changes: The total number of failed changes such as rollbacks or incidents triggered by those changes.
- Total number of changes: The total number of changes made during the given time, such as code deployments, updates, rollbacks, incidents, or releases.
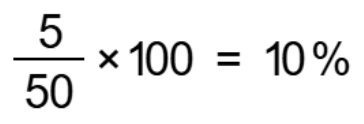
A project had a total of 50 changes deployed, out of which 5 resulted in failures.
Therefore, Velocity calculates CFR as follows:
Display of the CFR metric in Velocity
In Velocity, the CFR metric is displayed on the Dashboards and Value Streams pages:
- Dashboards page: CFR is displayed in the Dashboards by using a graph, which dynamically shows changes in the failure rate over time. You can group by days, month, week, quarter, year or with custom dates.
- Value Streams page: The Value Streams page shows
the CFR for changes in a specific value stream. It shows the percentage of
failed changes in the value stream over the last 90 days.
The result is presented on the Value Streams page, which helps stakeholders to view the overall stability and reliability of the deployment process for the value stream.