Customizing metric definitions for Lead Time, Cycle Time, and Dev Cycle Time
You can now select multiple start and end stage for a metric, enabling a more accurate representation of the actual workflow across teams. Because the definition of work start and end times can vary depending on the tools, processes, and delivery practices used. This provides teams and stakeholders with clearer insights into the actual flow of work, supporting better decision-making, increased transparency, and continuous improvement adaptability for the team.
The metric is calculated as the median duration between all selected start and end stages. This ensures the measurement reflects the entire workflow and accurately captures the time spent across all phases.
- Hover over the metric, click
 and then select
Edit.
and then select
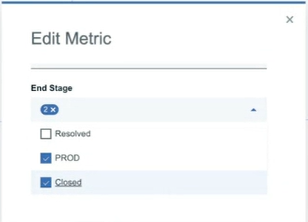
Edit. The Edit Metric dialog is displayed.
- Select one or more stages from the drop-down list of Start
Stage and End Stage for the metric.
- Click Update.
The updated metric definitions are saved in the vsm.json file, and the static metric graphs are updated for Lead Time, Cycle Time, and Dev Cycle Time in Insights dashboard.
Example: Calculation of Cycle time when multiple stages selected for end stage
| Work item | Start Stage | Start date | End Stage | End date | Duration |
|---|---|---|---|---|---|
| A | Active | June 1 | Closed | June 7 | 6 days |
| B | Active | June 3 | Production | June 10 | 7 days |
| C | Active | June 3 | Production | June 7 | 4 days |
| D | Active | June 2 | Production | June 5 | 3 days |
| E | Active | June 7 | Production | June 12 | 5 days |
| F | Active | June 5 | Production | June 10 | 5 days |
Cycle time calculation: The distribution of the cycle times of all work items completed during the last 30 days. The calculated durations from the above table are sorted in ascending order. For example, if the duration values are [6, 7, 4, 3, 5, 5], they are reordered as [3, 4, 5, 5, 6, 7]. The Median Cycle time over this period is 5 days, with 75 percent of items reaching completion within approximately 6.25 days.