Managing swim lanes
Use swim lanes to display a user-centered view of your value stream data.
About this task
| Role | Dynamic swim lanes view |
|---|---|
| Developers, scrum masters, daily stand-up | View work items per person, show and hide selected stages, and choose sprint view for displaying pointed data sets. |
| Development managers, director | Check overall sprint status, view stage position of work items, display remaining work from past sprints for possible future sprint allocation, and click SPRINT for a consolidated work item view displaying the current status. |
| Scrum masters, development managers | For tracking targeted Epics, use the pinning feature to keep the prioritized items at the top of the list. |
| All roles | Dynamic swim lanes display current state of releases, contents of both upcoming and past releases, determine when work items are released, view work items per stage, and click RELEASE for a detailed release contents list and click SPRINT for the same result. |
- Owner (all rows displayed)
- Priority (all rows displayed)
- Release (five rows displayed)
- Sprint (five rows displayed)
- Epic (all rows displayed)
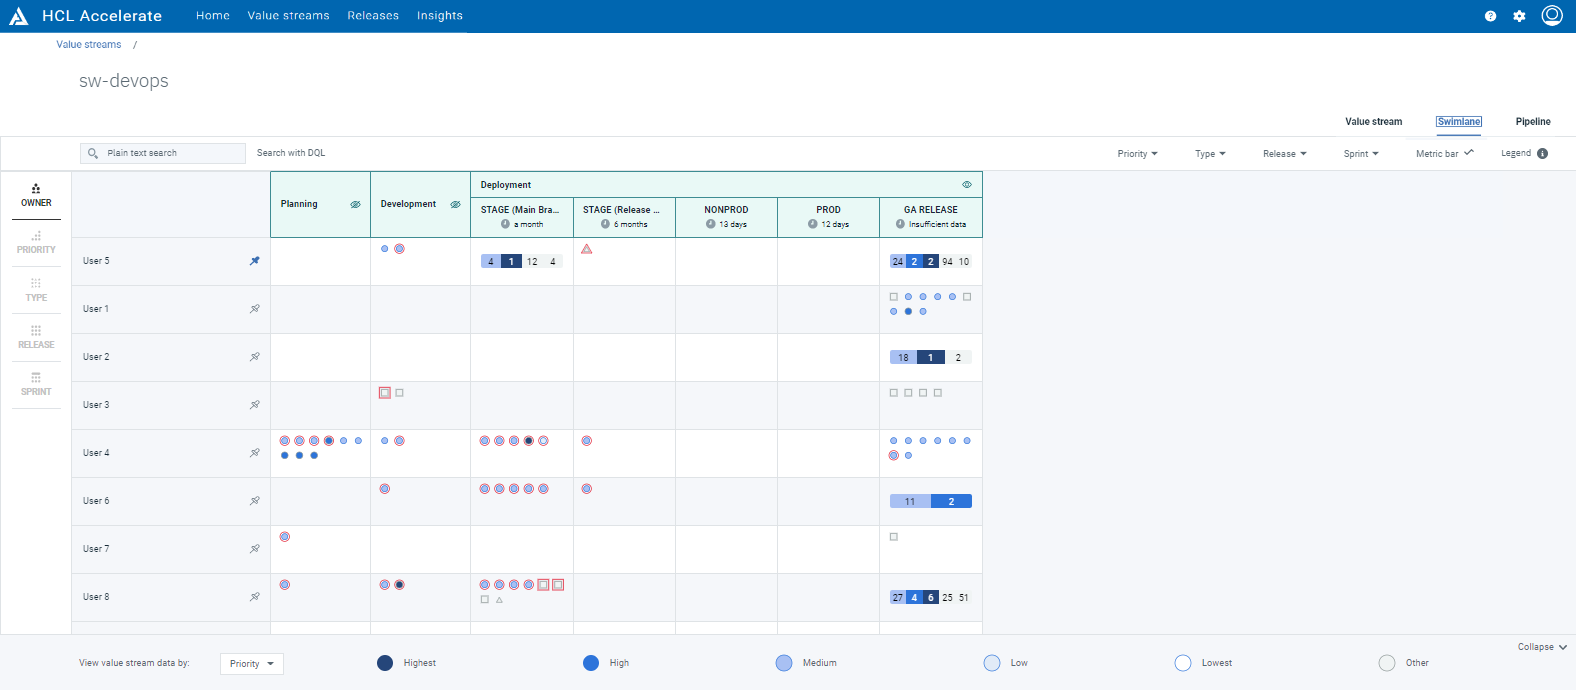
On the right side of the dynamic row selector is the rows overview panel. The row contents vary according to the specific property selected in the dynamic row selector and you can click on any row to display the row panel shown on the right of the rows overview panel where you can view dots in each stage for a specific row. You can also expand and collapse sections in the row panel by clicking the down and up arrows on the right of the section names as shown in the following illustration.
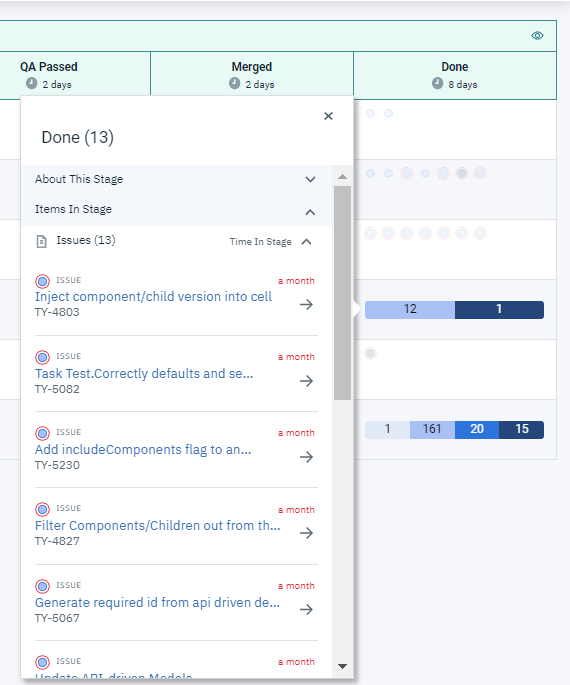
You can show and hide phases and associated stages by clicking  and
and  respectively with both located on the right side of the phase names in the column
fields above the data table. When you hide phases, a high-level progression view is displayed. When
you show phases, a detailed view of items in stages is displayed. Also, when you click on the phase
names in the column fields above the data table, a row panel is displayed containing the associated
stages with the phase. You can also expand and collapse stage sections to view phase dots according
to the stage position in the phase. Additionally, you can click on any of the summary bars in the
data table to display a row panel with the same aformentioned features as shown in the following
illustration.
respectively with both located on the right side of the phase names in the column
fields above the data table. When you hide phases, a high-level progression view is displayed. When
you show phases, a detailed view of items in stages is displayed. Also, when you click on the phase
names in the column fields above the data table, a row panel is displayed containing the associated
stages with the phase. You can also expand and collapse stage sections to view phase dots according
to the stage position in the phase. Additionally, you can click on any of the summary bars in the
data table to display a row panel with the same aformentioned features as shown in the following
illustration.
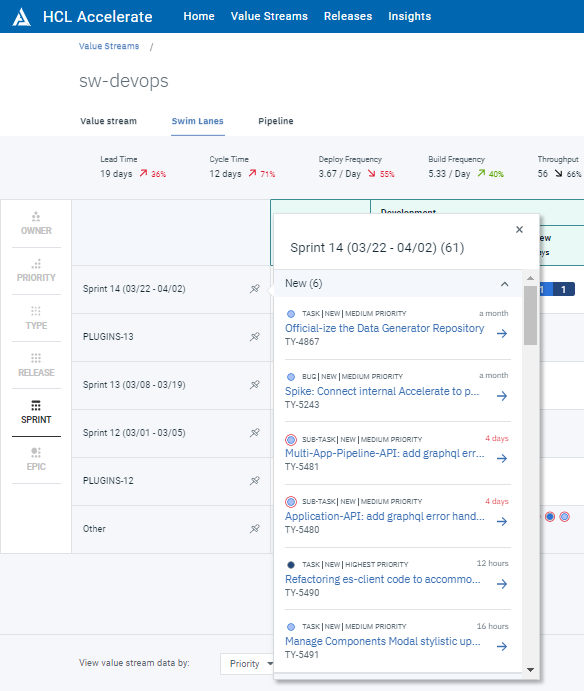
 for the required row and it remains at
the top of the row overview panel with last item pinned on top. To unpin an item, click
for the required row and it remains at
the top of the row overview panel with last item pinned on top. To unpin an item, click  to remove the priority item.
 The functionally available on the Value stream view is available here as well; you can access the Metric bar and text and DQL query field.
To display a swim lane, complete the following steps:
Procedure
- On the HCL™ Accelerate Home page, click , and then select a value stream.
-
On the value stream page, click Swim Lanes.
The swim lane is displayed.