Lesson 4: Play back the script
In this lesson, you will play back the script and look at some parts of the HCL DevOps Test UI (Test UI) interface. Because the script you just recorded is the active script, that script will play back when you click the playback button.
To start at the beginning of the tutorial, see the Test UI Tutorial.
Because the script you just recorded is the active script, that script will play back when you click the playback button.
-
To play back the script, click the Run Functional Test Script button
 on the product toolbar, or click Script > Run.
 -
In the Select Log dialog, keep the default log name of Classics and click Finish.
The Test UI window minimizes, and the Playback Monitor opens at the top right of your screen. As the script plays back, messages display in the Playback Monitor. Test UI plays back all of your recorded actions, such as the application starting, the actions you performed on the application, and the verification points.
When playback finishes, the HTML log displays the results of the run in a separate window. If the log is minimized, restore it. All events listed in the log should include Pass in the event headings in green. Notice that the two verification points you recorded are listed.
-
Close the log window.
Now that you have successfully recorded a script and played it back, let's look at the Functional Test perspective in more detail.
-
If the Test UI window is minimized, restore it.
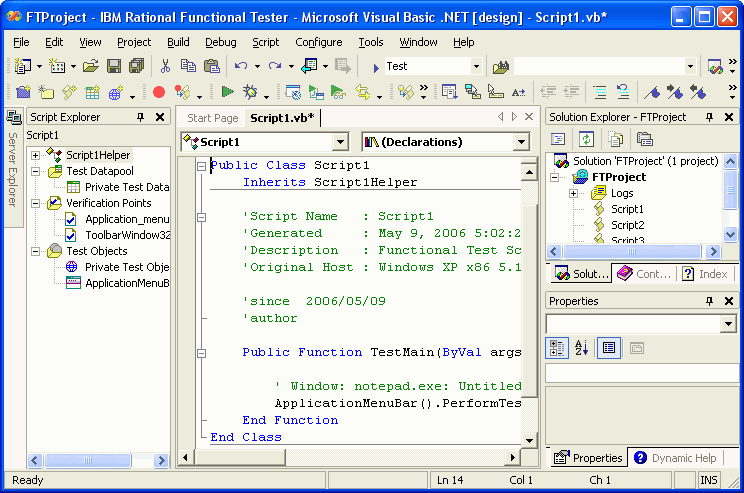
When you have multiple scripts, Test UI displays all open scripts in a project in the Editor (the script window). Each script has a tab in the banner of the window, and the tab for the active script shows the script name in bold. Any actions you perform on a script, such as playing it back, are performed on the active script.
Throughout the script, notice the information about the script shown at the top in light blue and prefixed by asterisks. This information comes from the script template, which you can modify. For more information, see Customizing a Script Template.
Notice also that Test UI adds a short comment to the script in green characters to identify the object that the following lines refer to. This information makes it easier to navigate the script. Strings passed as arguments to methods during recording, including user inputs, are bright blue.
The Solution Explorer pane lists the Functional Test projects that you are currently connected. All scripts within each project are listed below the project name. This Solution Explorer provides another way to navigate to a different script. When you double-click a script in the Solution Explorer, it opens in the script window and becomes the active script. For more information, see the Solution Explorer.

The Script Explorer lists the verification points and object map of the active script. From the Script Explorer you can start the Verification Point Editor to display and edit verification points, and start the object map editor to display and edit object maps. For more information, see Script Explorer.
For information about the other parts of the Test UI window, see About the Visual Studio .NET Window.
Advance to Lesson 5: View verification points and object maps.