Monitoring metrics exposed by an OpenMetrics exporter
With HCL OneTest™ Server, you can monitor your system resources by using metrics data that are exposed by an OpenMetrics or a Prometheus exporter through metric counters while executing a schedule.
Before you begin
You must have at least one exporter or software to expose monitoring metrics with an OpenMetrics or Prometheus format.
You must have created a project in HCL OneTest™ Server.
No Prometheus server installation is required, you only need to set up one or multiple OpenMetrics, or Prometheus exporters that fit your software or host target. Refer to the link at the end of this page to see the list of exporters.
About this task
The following procedure describes how to select and create OpenMetrics counters in HCL OneTest™ Server. You must set a connection between HCL OneTest™ Server and the OpenMetrics exporter to select counters.
Procedure
- Click Add a source and select Add an OpenMetrics exporter .
-
In the New OpenMetrics exporter dialog that opens,
enter the OpenMetrics exporter details to access its exposition endpoint as
follows:
- Click the checkboxes to select counters in the Select OpenMetrics counters dialog.
-
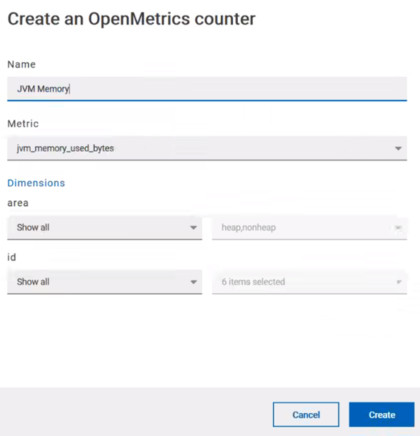
Follow these steps to create a counter:
-
Follow these steps to duplicate a counter:
-
Select a counter in the list, and click the
Duplicate icon
 .
.
- Modify the name of the counter and the Dimensions.
- Click Create.
-
Select a counter in the list, and click the
Duplicate icon
-
Proceed as follows to modify a new counter:
- Click the Modify icon.
- Modify the name, Metrics, and Dimensions of the counter in the Modify the OpenMetrics counter.
- Click Update.
Note: You can create, duplicate, or update a counter only if the name of the counter is not already used. -
Click Save and close the Select OpenMetrics
counters dialog.
Note: You can delete counters, but only the ones that you created or duplicated.


