Viewing logs
Use the Log Viewer in Code when you need to view, filter, or download log output from your dev containers or from Code itself. You can diagnose launch failures, unexpected container behavior, or errors that you want to share with a support team.
Before you begin
- You have opened the Code landing page.
- You are a member of at least one teamspace, if you want to view the container-level logs.
About this task
Log Viewer opens as a panel within the Code interface. You access it from the help menu in the top-right corner of the page. Once open, you can switch between Code logs and dev container logs using the Source dropdown, apply severity filters, search log entries by keyword, and download captured logs as a file. The Log Viewer captures trace logs from your running dev containers and from Code itself. It does not capture output from applications that run inside the dev containers, for example, the output of a Node.js application.
Procedure
-
Open the Log Viewer:
- Onthe Code
landing page, click the help icon (top-right).
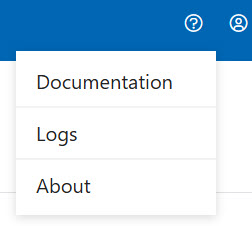
- In the dropdown menu, click Logs. The Log Viewer panel opens.
- Onthe Code
landing page, click the help icon (top-right).
-
Select a log source:
- In the upper-right area of the Log Viewer panel, click the
Source dropdown.
- To view logs for a container or containers grouped by their teamspace,
select the teamspace name from the Source
dropdown, then select an individual container if needed.
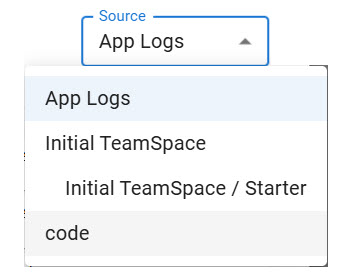
App Logs show internal logs of Code, not logs from apps inside the dev containers.
- In the upper-right area of the Log Viewer panel, click the
Source dropdown.
-
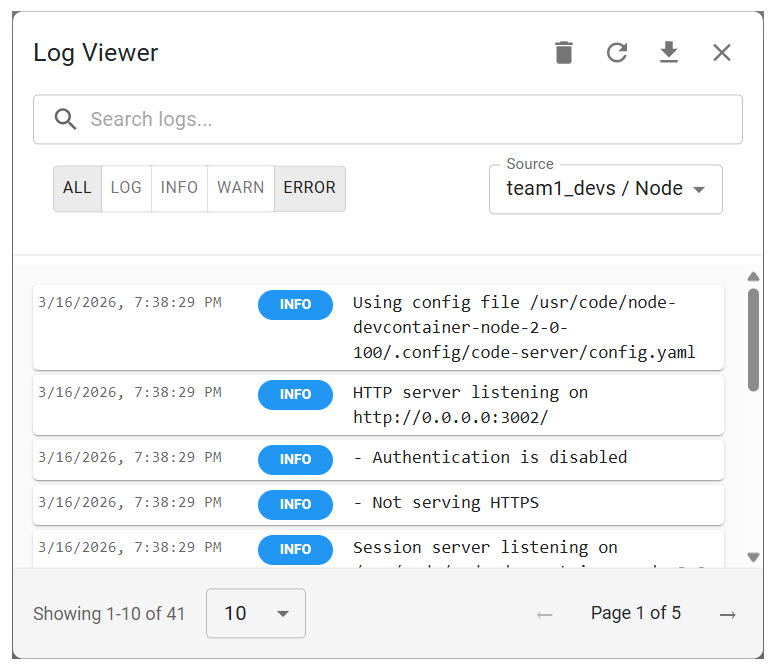
Filter the log output:
- In the search bar at the top of the panel where there is the Search logs... placeholder, type a keyword to narrow entries by matching text.
- Click one or more filter buttons to show only entries of that severity
level. The following filters are available:
Button Description ALL Displays all log entries regardless of level. LOG Shows log entries without severity levels by using a generic format to record plain-text, non-critical data for simple auditing. INFO Shows informational messages about normal operational activity. WARN Shows warning-level entries, indicating conditions that might lead to errors. ERROR Shows error-level log entries, indicating failures that require attention. Note:You can enable multiple filters simultaneously. For example, selecting both WARN and ERROR shows only warning and error entries together. - To load the latest entries, click the Refresh icon in the top-right area of the panel.
-
View log entry details:
- Locate the log entry you want to inspect. Each row shows a timestamp, a color-coded level badge (for example, INFO or ERROR), and a short message.
- Click the expand arrow on the right side of the row. When expanded, the entry displays sections such as Details, which indicates that the entry is expanded and contains further information, and Context, which provides the namespace and pod name associated with the error.
- Click the collapse arrow to close the expanded view and return to the compact list.
-
Adjust the number of displayed entries:
- At the bottom of the panel, click the count selector on the left (default is 10) and select a different value to change how many entries are shown per page.
- Use the arrow controls to move between pages.
-
Download the logs:
- Click the Download icon in the top-right area of the Log Viewer panel.
- Save the exported file to your local system. Note:The download exports only the entries that are currently visible based on your active source and filter selections. Adjust your filters before downloading if you need a specific subset of entries.
Results
What to do next
- If you identified an error in the logs, see Configuring dev containers to adjust the settings that may be causing the issue.
- If the issue persists, share the downloaded log file with your administrator for further investigation.