Dashboards
The dashboard system consolidates data from all key applications, such as Plan, Control, Build, Deploy, and Test by offering a centralized view of the status. Dashboards are available with both summary and detailed perspectives, and they filter information specific to each loop.
Upon loop creation, two dashboards per tier are automatically provisioned and linked directly to the workspace of each loop. These dashboards are universally visible, regardless of the user’s licensing tier. You might see tier-specific differences in the dashboard that might arise from the depth and variety of data sources through integrated applications for a specific tier. The default dashboards are preconfigured for immediate use.
For advanced analytics, DevOps Loop includes a milestone risk assessment feature, which requires an optional plug-in.
Accessing the dashboards
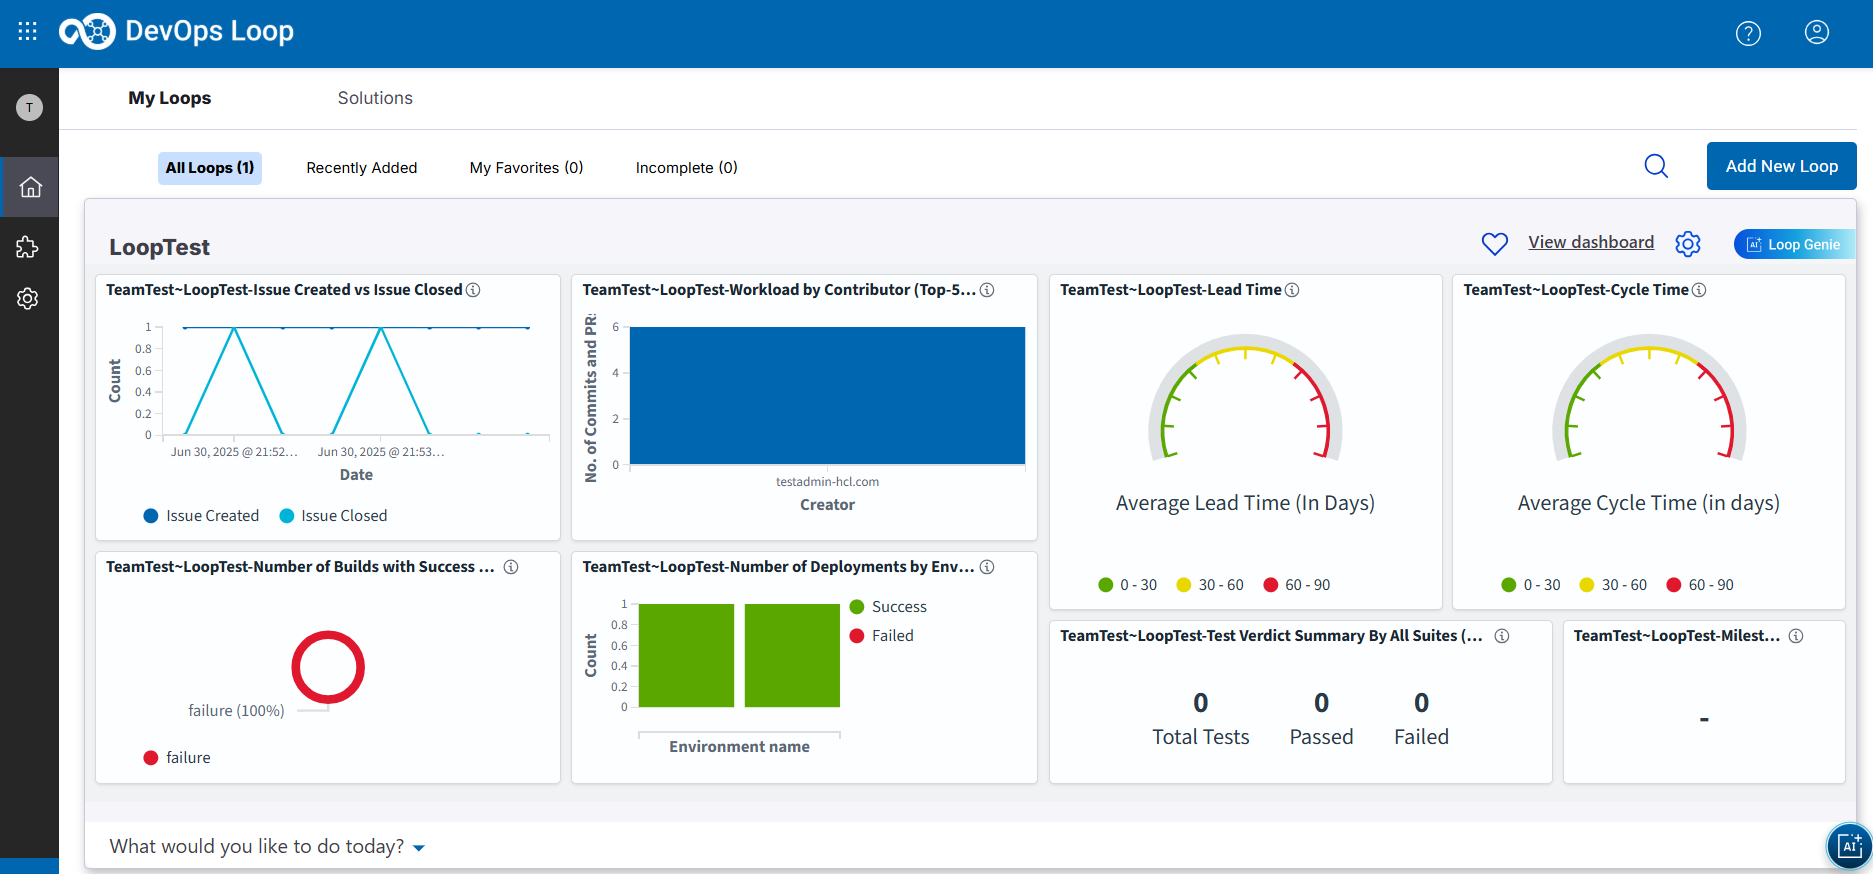
- Issue Created vs Issue Closed
- Workload by Contributor (Top-20/All team)
- Test Verdict Summary By All Suites (Overview)
- Number of Builds with Success and Failure
- Number of Deployments by Environment
- Milestone Risk
- Lead Time
- Cycle Time
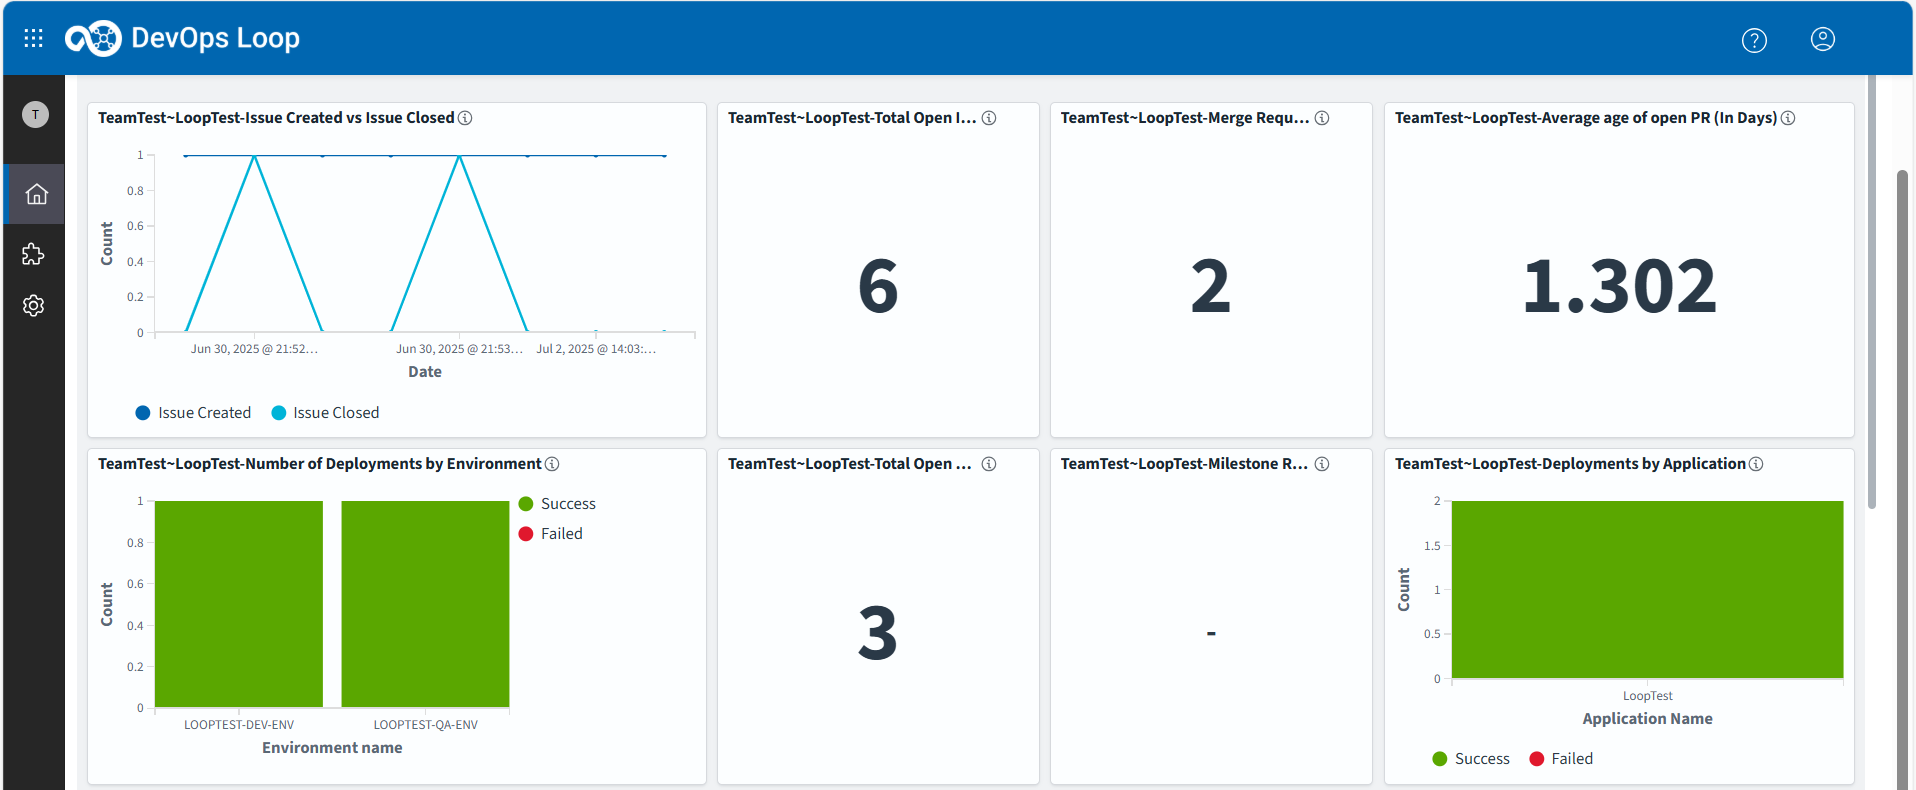
- Issue Created vs Issue Closed
- Total Open Issues
- Merge Request (PR main)
- Average age of open PR (In Days)
- Number of Deployments by Environment
- Total Open Pull Requests
- Milestone Risk
- Deployments by Application
- Number of Builds with Success and Failure
- Lead Time
- Cycle Time
- Workload by Contributor (Top-20/All team)
- Most Recent Deployment Status
- Test Verdict Summary By All Suites (Overview)