Dashboard
The Dashboard is a live page that gives you real-time insights into the status of your deployments and agents through graphs and charts.
The following screenshot is an example representation of the Dashboard page:
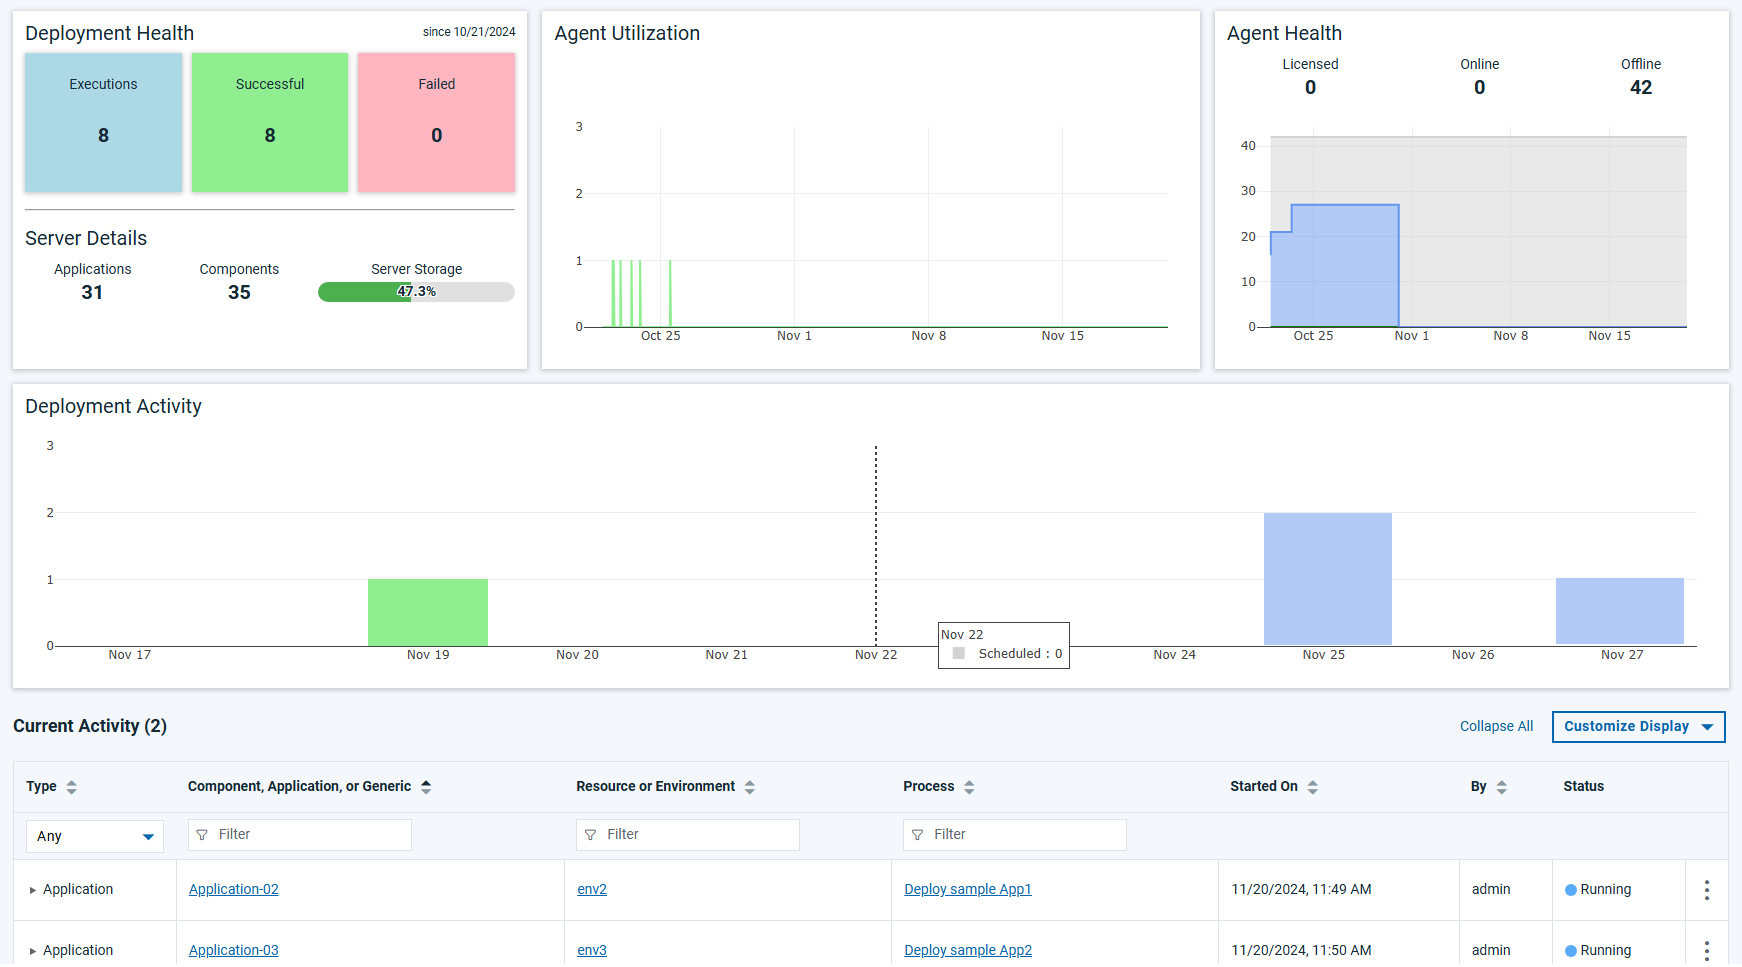
Deployment Health
The Deployment Health widget gives you an overall status of your deployments in the last 30 days.
| Widget part | Description |
|---|---|
| Executions | Displays the total number of deployments executed. |
| Successful | Displays the total number of successful deployment jobs. |
| Failed | Displays the total number of failed deployment jobs. |
| Server Details |
|
Agent Utilization
The Agent Utilization widget is indicative of the agent usage data. It displays a time series chart along with counts to show the agents' usage data for the last 30 days.
Agent Health
The Agent Health widget gives you an insight into your agent's health. It displays a
time series chart along with counts to show the agents' health data, including
Total Licensed, Total Online, and
Total Offline for the last 30 days.
Deployment Activity
The Deployment Activity widget shows you scheduled deployment counts. It displays a bar chart to show the scheduled deployment jobs count starting with the last 2 days till the next 7 days from the current date.
Current Activity
The Current Activity widget gives you an insight into your active deployments. It
displays a table view to give you details on active deployments, that includes
deployment information such as Type, Component,
Application, or Generic, Resource or Environment,
Process, and Start Time.