WebSphere Commerce PMI module performance monitoring
You can monitor the performance of your WebSphere Commerce system by using the WebSphere Application Server Performance Monitoring Infrastructure (PMI). Administrators can monitor the system based on the infrastructure provided by WebSphere Application Server and can monitor URLs and task commands by checking additional WebSphere Commerce counters.
The WebSphere Commerce application server gathers statistics for URLs, tasks, and views. Each data key has an associated set of counters that provide information. For example, the average response time of a task, maximum and minimum response times, and the total number of times a task was called.
To set up the WebSphere Application Server PMI, see the Monitoring topic.
- Open the WebSphere Commerce configuration file.
- Find the component that contains the class name: com.ibm.commerce.performance.monitor.PerfMonitor.
- Change the enable attribute to false.
- Save the changes you made, and exit the file.
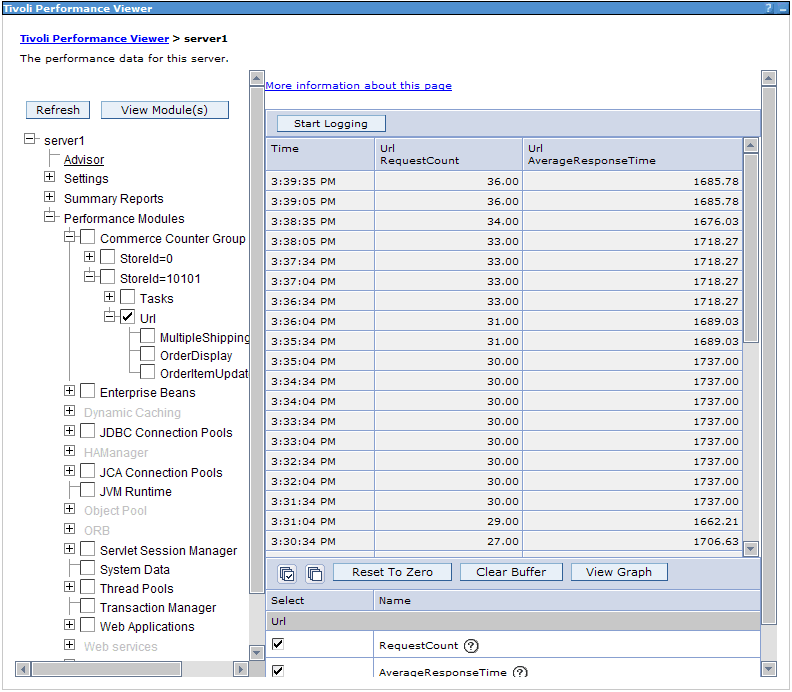
Start the Tivoli Performance Viewer; then from the Resource Selection panel, expand Commerce Counter Group. The data is grouped according to Tasks, URLs, and Views under the Store ID. All task commands are found only under StoreId=0. After a particular URL, View or Task command is selected from the Resource Selection Panel, the Counter Selection Panel shows the WebSphere Commerce counter. See Monitoring performance with Tivoli Performance Viewer (TPV) .
In a clustered environment with a deployment manager, an additional step is required before the Commerce Counter Group counters can be enabled. Copy the Enablement-BaseComponentsLogic.jar file to the WebSphere/AppServer/classes directory of the deployment manager node. If it does not exist, create the classes directory. Although it is not necessary, you can safely remove the ".class" files from the copied JAR file, as only the .properties and .xml files are used by the deployment manager.
The following list shows counters that are included for each task, URL, or view. All timing values are elapsed time (usually in milliseconds where appropriate):
- Counter Name
- Definition
- Average response time
- Average response time of task
- Last response time
- The last response time of a task.
- Minimum response time
- Minimum response time of a task.
- Maximum response time
- Maximum response time of a task.
- Hits
- The total number of times a task was called.
- Total response time
- Total response time of a task.
- Standard deviation
- Standard deviation of response time. The formula used to calculate the standard deviation assumes that the data conforms to a standard distribution.
Monitor Java resources
From the Application server side, Tivoli Performance Viewer can be used to monitor resources inside the running JVM.

Tivoli Performance Viewer (TPV) provides a graphical interface to capture and show various resources. For example, the current size of the web container thread pool or the response time of individual EJBs.
- Commerce Counter Group (for example, find the response time of task commands).
- Enterprise bean (for example, find the response time of an individual entity or session bean).
- Dynamic caching (for example, find the cache statistics, such as cache hit versus cache miss).
- JDBC Connector (for example, determine the number of JDBC connections that are currently being used).
- Thread Pools (for example, determine the number of threads that are currently being created).
- Web Application (for example, determine the response time of individual JSP files).