Overview
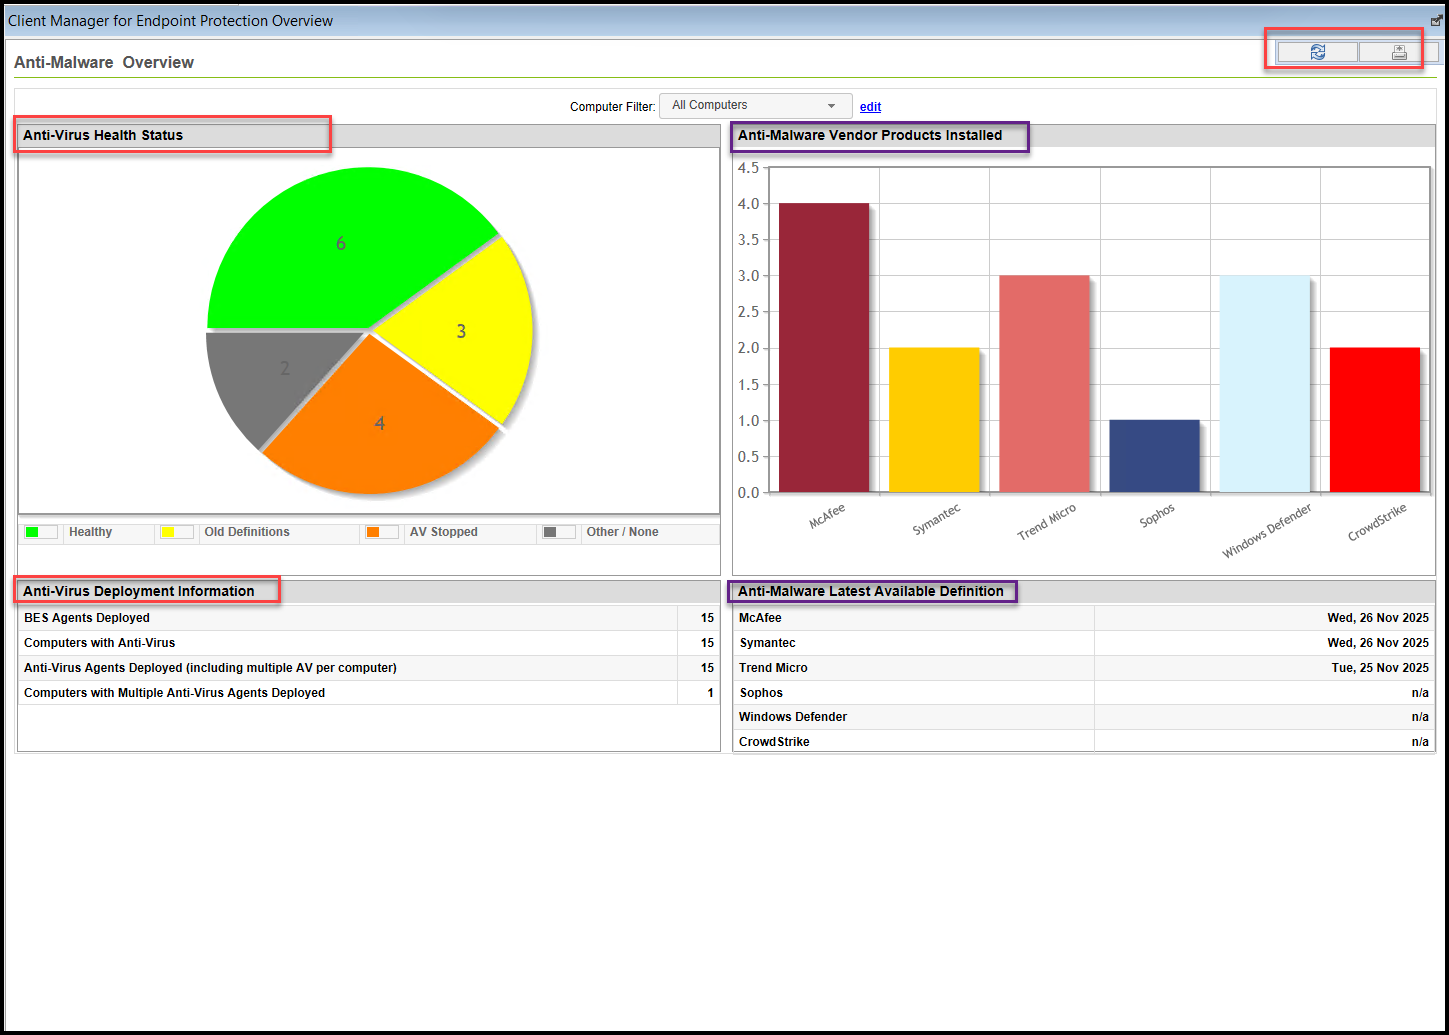
The Client Manager for Endpoint Protection Overview window provides a summary of Anti-Virus health and Anti-Malware products in your deployment.
The left side of the Overview window contains an Anti-Virus Health Status pie chart and Anti-Virus Deployment Information statistics. The right side contains an Anti-Malware Vendor Products bar graph with dates of the latest available Anti-Malware definitions.
The top of the report shows the Computer Filter, which sets the criteria of what is shown in the Overview Report. The upper-right corner includes the Refresh, Printer, and the Export PDF buttons.

The following table illustrates the color-coding used for the Anti-Virus Health Status pie chart, as well as a brief description of each category:

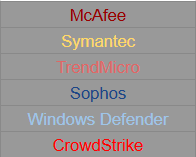
The Anti-Malware Vendor Products bar graph is color-coded according to vendor, as shown in the previous image.

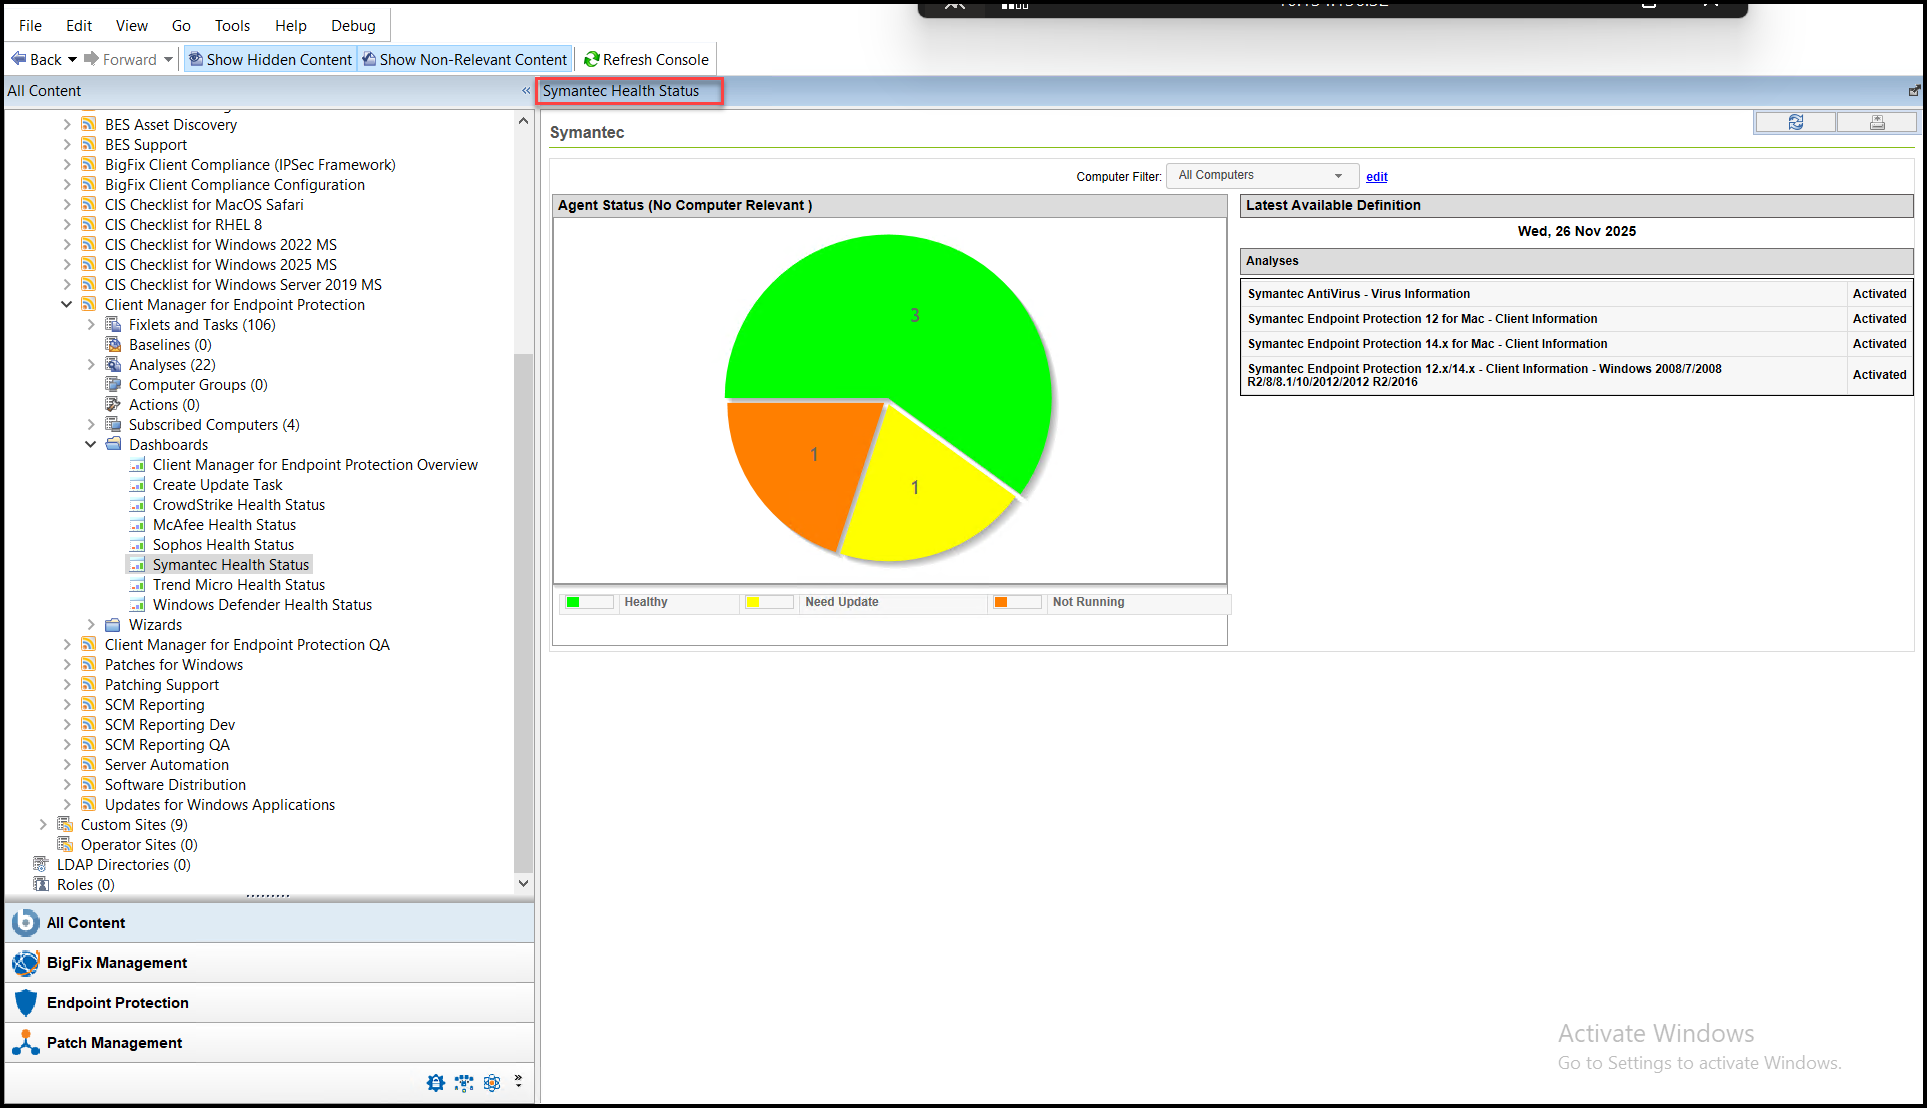
You can select individual vendors to display a customized pie chart and summary. For example, by selecting to view the Symantec Health Status report, the dashboard displays the Symantec health status pie chart, the date of the latest definition release, and a list of related analyses with either Activated or Not Activated status.

The Agent Status section displays pie charts representing the health and status of your Anti-Virus according to each vendor. Status is measured by the following criteria:
Healthy: Anti-Virus applications are running correctly on this machine.
Need Update: Virus definitions need to be updated on this machine.
Not Running : The required Anti-Virus application or service is not running.