Dashboard
The dashboard shows a summary of the scan's configuration, status, data, and results.
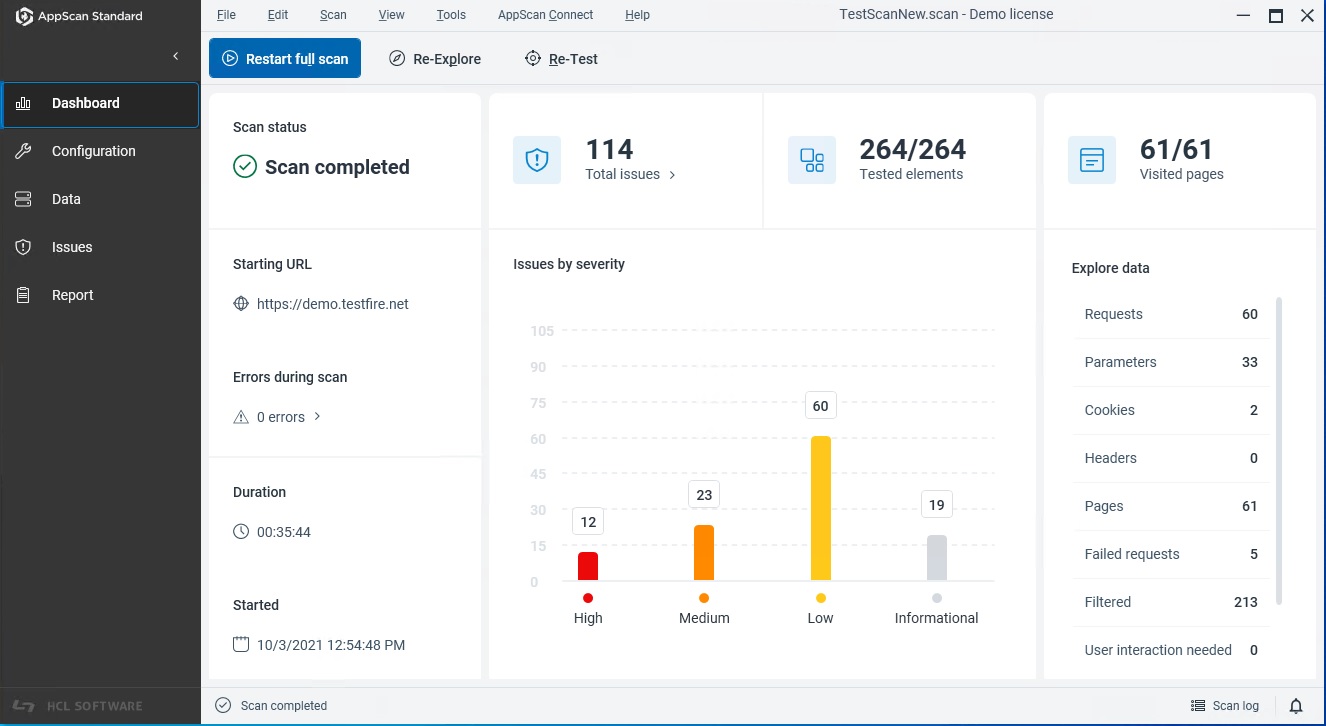
Dashboard sections
The following table describes the main areas of the dashboard.
| Section/Menu item | What it shows/Function | Typical actions |
|---|---|---|
| Scan summary | High-level scan information: scan name, target, status (running/completed), start time, and duration. | Verify you are scanning the correct target and confirm the current state of the scan. |
| Issue summary | Vulnerabilities found, grouped by severity (for example, Critical, High, Medium, Low, Informational). | Drill down into issues by severity to review details, evidence, and remediation guidance. |
| Explore data | Key indicators such as total pages, parameters, forms, and requests explored and tested. | Identify gaps; refine scan scope, add exclusions/inclusions, or extend authentication. |
| Unexplored domains | Domains that AppScan discovered but has not explored. | Add newly discovered unexplored domains to your scan configuration and restart a full scan to explore them. |