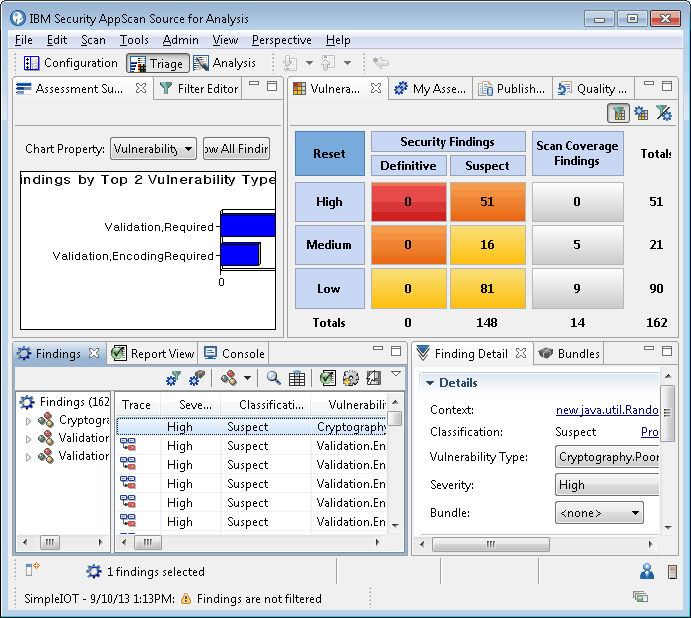
The AppScan® Source for Analysis workbench
AppScan® Source for Analysis workflow occurs in a workbench, which consists of perspectives, views, and editors that display or are hidden, depending on context.
Perspectives
The three perspectives in the product - Configuration, Triage, and Analysis - consist of multiple views. Although each perspective opens with default views, you can reorganize views to customize each perspective. The views are described in detail in the Views and windows section of the help.
- Configuration Perspective: Create and manage applications, projects, and attributes.
- Triage Perspective: View scan results to prioritize remediation workflow and separate real vulnerabilities from potential ones. This perspective can be used to isolate the issues that you need to fix first.
- Analysis Perspective: Drill down into individual findings - and review source code, remediation advice, and AppScan® Source trace information.
Workbench window
The AppScan® Source for Analysis workbench window consists of these elements:
- Main menu: Menus that access AppScan® Source for Analysis functions
- Toolbar: Icons and buttons for frequently-used functions
- Perspectives: Collections of views
- Views: Presentations and ways to navigate the information in the workbench

Toolbars and information at the bottom of the workbench
- Fast View toolbar: Fast views are hidden views that can be quickly opened and closed. They work like other views except they do not take up space in your workbench window. Fast views are represented by toolbar buttons on the fast view bar, which is the toolbar on the bottom left of the workbench window. When you click the toolbar button for a fast view, that view opens temporarily in the current perspective (overlaying it). As soon as you click outside that view or the view loses focus it is hidden again. To set a view as a fast view, click Show View as a Fast View and then choose the view from the menu.
- Selected findings: When findings are selected, an indicator at the bottom of the workbench displays the number of selected findings.
- Source file information: When a source file is open, this information
about the file displays at the bottom of the workbench:
- Whether the file is writable or read-only. If you attempt to edit a read-only file, a prompt in AppScan® Source for Analysis will allow you to set the file to writable.
- If your operating system input mode is insert or overwrite.
- The current cursor location in the file (line and column number).
- Server connection information: Hovering over the user icon indicates the user that is currently logged in to the AppScan® Enterprise Server - and hovering over the server icon allows you to see the AppScan® Enterprise Server that AppScan® Source for Analysis is connected to.
- When an assessment is open, the bottom of the workbench includes
this information:
- The name of the assessment, and the date and time of its creation.
- An indicator that allows you to quickly determine how filters have been applied to the findings in the assessment. See Determining applied filters for more information.
- A progress indicator is also displayed at the bottom of the workbench that indicates actions in progress. For example, this indicator appears during scans and assessment publication. In addition, this section indicates when an assessment is open.