Monitoring calls for selected links
Use the Link Calls table to monitor details for calls on a selected link within the network managed by IBM® Sametime® Bandwidth Manager.
About this task
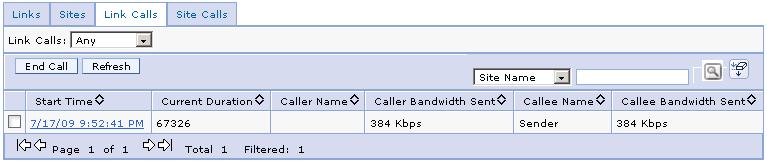
The monitoring interface includes tabs for links, sites, link calls, and site calls. The Link Calls tab shows calls that are currently in progress. By choosing a specific link in the Link Calls list, the administrator can limit the calls shown to those using the selected link. Choosing Any will cause all calls in progress to be displayed.
Clicking a call in the Start Time column opens the Call Details page, which provides the following information:
- Details about the caller: name, site, ID, IP address, bandwidth sent, and bandwidth received.
- Details about the callee: name, site, ID, IP address, bandwidth sent, and bandwidth received.
- Call route, including the total distance configured for the route taken by the call.
- Call rate policy, including peak usage policy.
To monitor calls for a link or links, perform the following steps:
Procedure
- On the server hosting the bandwidth manager, open the IBM WebSphere® Application Server Integrated Solutions Console and log in as the WebSphere administrator.
- Click .
- Click the Monitoring tab.
- Click the Link Calls tab on the monitoring page.
- Optionally, click a specific link in the Link Calls list to see calls in progress for that link only. To see all calls currently in progress, choose Any.
- Click the Link Calls tab to see a table of calls currently in progress.
- In the Links table, click a link name in the Name column to see the site configuration page for that link.
- In the Links table, click a number in the Calls column to see what calls are currently using bandwidth in the link displayed in that table row.
- End any call by checking the check box preceding the start time for that call and then clicking the End Call button. To refresh the list of calls at any time click the Refresh button.