Using the Kibana data visualization plug-in
Get a graphical view of your Component Pack log data using the Kibana data visualization plug-in for the IBM® Cloud Private (ICp).
About Kibana
Kibana is an open source data visualization plug-in for Elasticsearch that is installed by default as part of Component Pack. It provides visualization capabilities on top of the content indexed on an Elasticsearch cluster. Users can create bar, line and scatter plots, or pie charts and maps on top of large volumes of data. Kibana running on the ICp masters allows you to visualize and monitor Orient Me logs.
Kibana 4.6.4 is compatible with ICp Elasticsearch.
Using the Kibana dashboard
- To view the Kibana dashboard, enter the following URL in a browser:
http://master_host_name:5601
In a HA environment, master_host_name will be the value of the
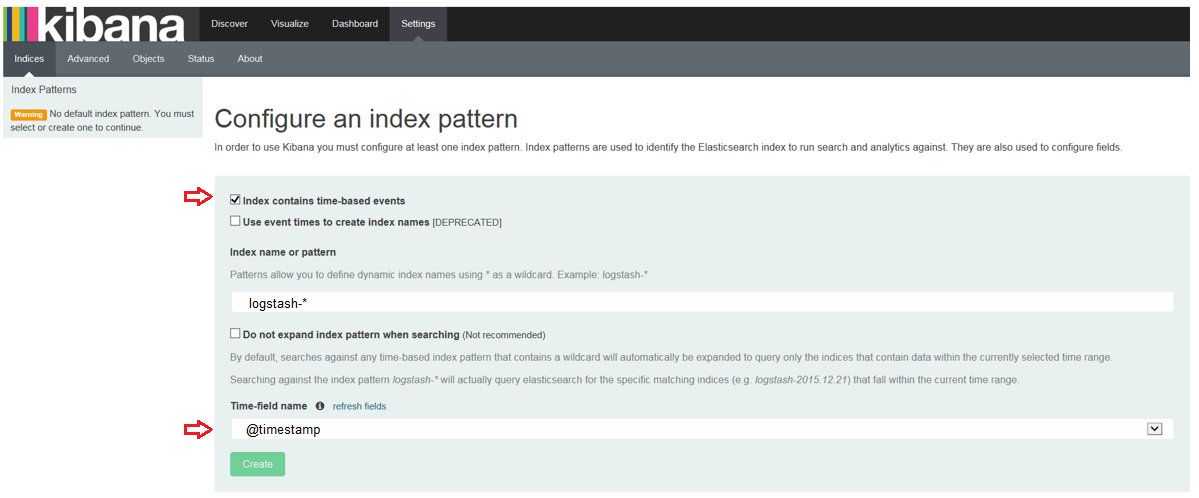
--master_HA_vipargument that was used during the installation of ICp. - After navigating to the Kibana URL in a browser, Kibana service prompts you to configure the
Kibana index pattern. To do so, select @timestamp as the
time-field name and accept the defaults for all other options.
Note: The Kibana service does not restart automatically after a server restart; run the following
commands to start Kibana again, replacing
<args> with the
same arguments you used during the
installation:/opt/deployCfC/B-25-master-install-kibana.sh <args>
docker exec -it kibana bash
chmod +r /kibana/*
exit