
Configuring and managing Fixlet charts
Use the Configure chart pane on the Fixlet Explorer – List View page to build custom visualizations of Fixlet data. After you create a chart, you can edit it, delete it, view its data as a table, or hide the whole Charts section.
About this task
The collapsible Charts section on the Fixlet Explorer – List View page creates visual summaries of Fixlet data. Define charts based on properties such as Source Severity, Category, or Source Release Date to identify high-priority vulnerabilities at a glance.
Procedure
-
In the Charts section, select Add
chart.
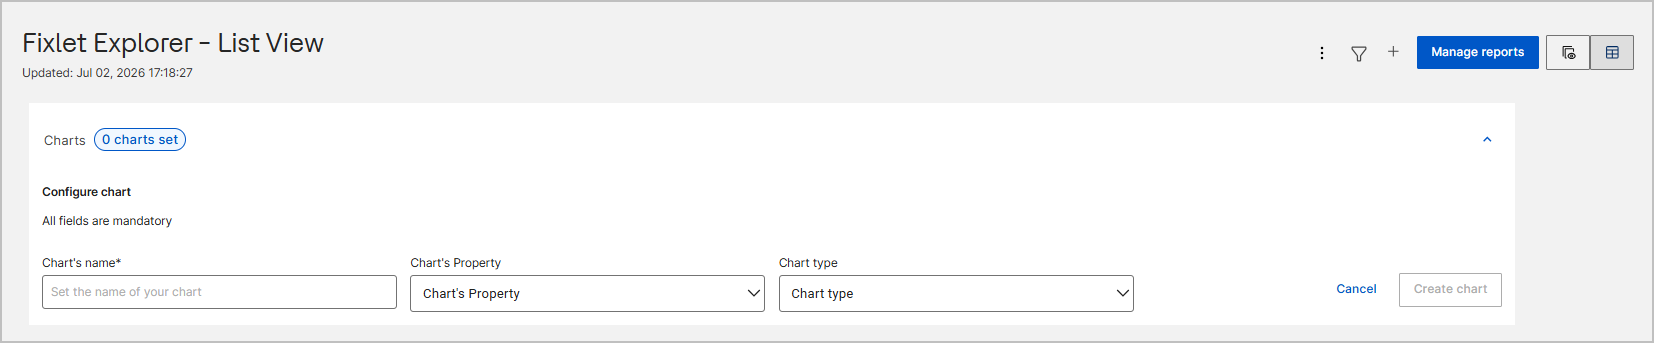
The Configure chart pane opens.
-
In Chart Name, enter a descriptive name for the chart.
A clear name helps you identify the chart later.
- From the Chart's Property dropdown, select the attribute to visualize, such as CVE, Source Severity, Category, or Source Release Date.
- From the Chart type dropdown, select the visual format: Horizontal chart, Vertical chart, or Pie chart.
-
Select Create chart.
This button stays dimmed until you provide information for all required fields. To close the pane without saving your changes, select Cancel.
The new chart appears as a tile in the Charts section. A NEW badge marks a recently added chart, and each tile shows the chart name and the property it visualizes. If the selected property contains no data for the current list, the tile displays No Data Available.
Results
The chart is available in the Charts section. Charts are interactive and work with the Fixlet table. For the steps to filter the Fixlet table from a chart, see Filtering Fixlets from a chart.
What to do next
After you create a chart, you can modify or remove it from the display.
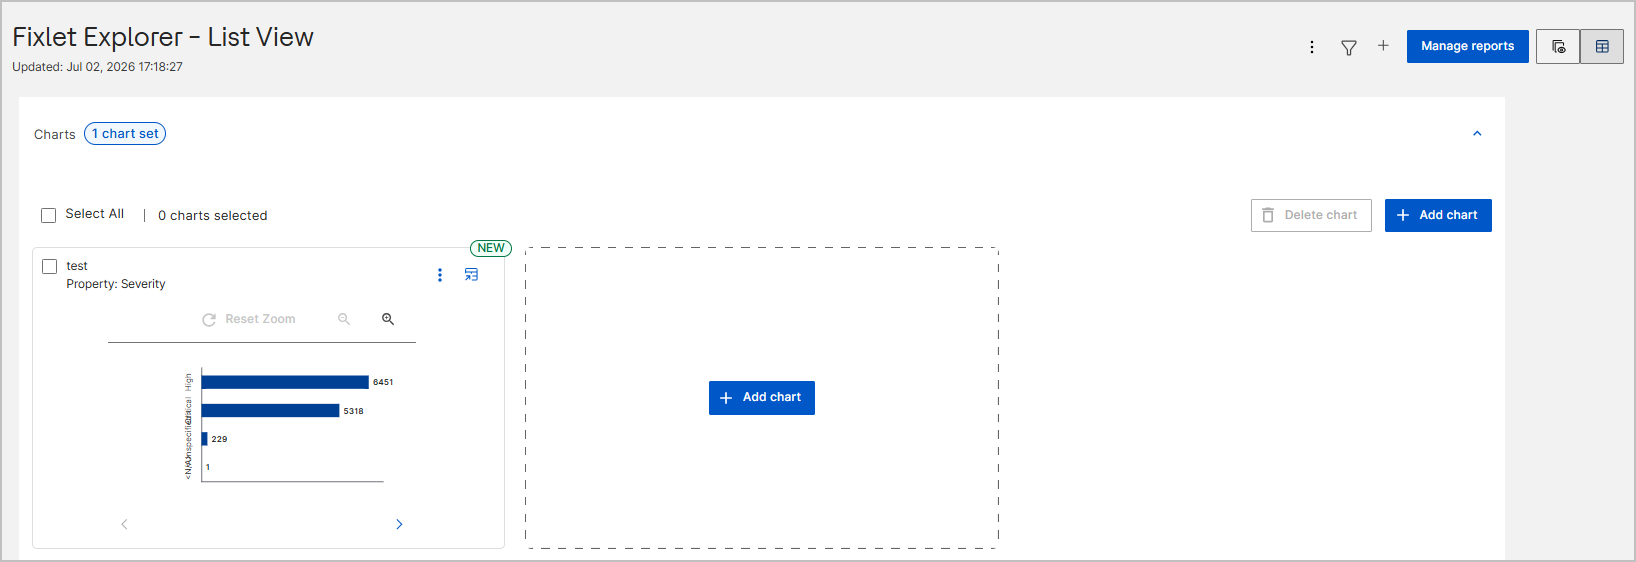
- To create more charts in the same view, select Add chart.
- To edit a chart, select the More options icon (three vertical dots) on the chart tile and then select Edit or Delete.
- To delete several charts, select the checkbox on the specific chart tile, or select Select All to choose all charts, and then select Delete chart.
- To view a chart's data as a table that you can copy or export, select the icon in the tile's top-right corner. For more information, see Viewing chart data in a table.
- To hide the Charts section, select the Collapse icon (upward arrow) in its top-right corner.