Deployment Details page
Review a single deployment's configuration, progress, and results across the Overview, Fixlets, Devices, and Components tabs.
The Deployment Details page offers a comprehensive view of a deployment's configuration, progress, and results.
The tabs displayed depend on whether the deployment is a standard single-action deployment or a Multiple Action Group:
- Standard deployments (single Fixlet, Task, or custom remediation): Includes three tabs - Overview, Fixlets, and Devices - to help you analyze outcomes, review script logic, and troubleshoot targeted endpoints.
- Multiple Action Group (MAG) deployments: When you deploy two or more Fixlets together, the Deployment Details page provides four tabs - Overview, Fixlets, Devices, and Components. Use the Components tab to monitor and drill down into each member action in the group.
The page features panels and widgets for Status, Tags, Configuration, Composition, Relevance, Action script, Devices, Fixlets, and Components, providing targeted insights that include execution logic and success criteria.
Select the name of the deployment from the Deployment Manager table view to drill down to the deployment details page, which has extensive details about that deployment's configuration and status. A breadcrumb at the top of the page (Deployment Manager > the deployment name) links back to the deployment list.
The page title shows an Updated line with the date and time the page data was last refreshed. The Delete and Stop buttons also appear at the top of the Deployment Details page, so you can stop or delete this deployment without returning to the Deployment Manager list. The same availability rules apply as in the Deployment Manager: you can delete only an expired deployment, and an open deployment must be stopped before it can be deleted. You can stop only a deployment that you issued. See the restriction in Deployments.
Overview tab
The Overview tab provides a summary of the deployment configuration, its progress, and current execution status. It gives you an instant snapshot of a deployment's configuration and completion status.
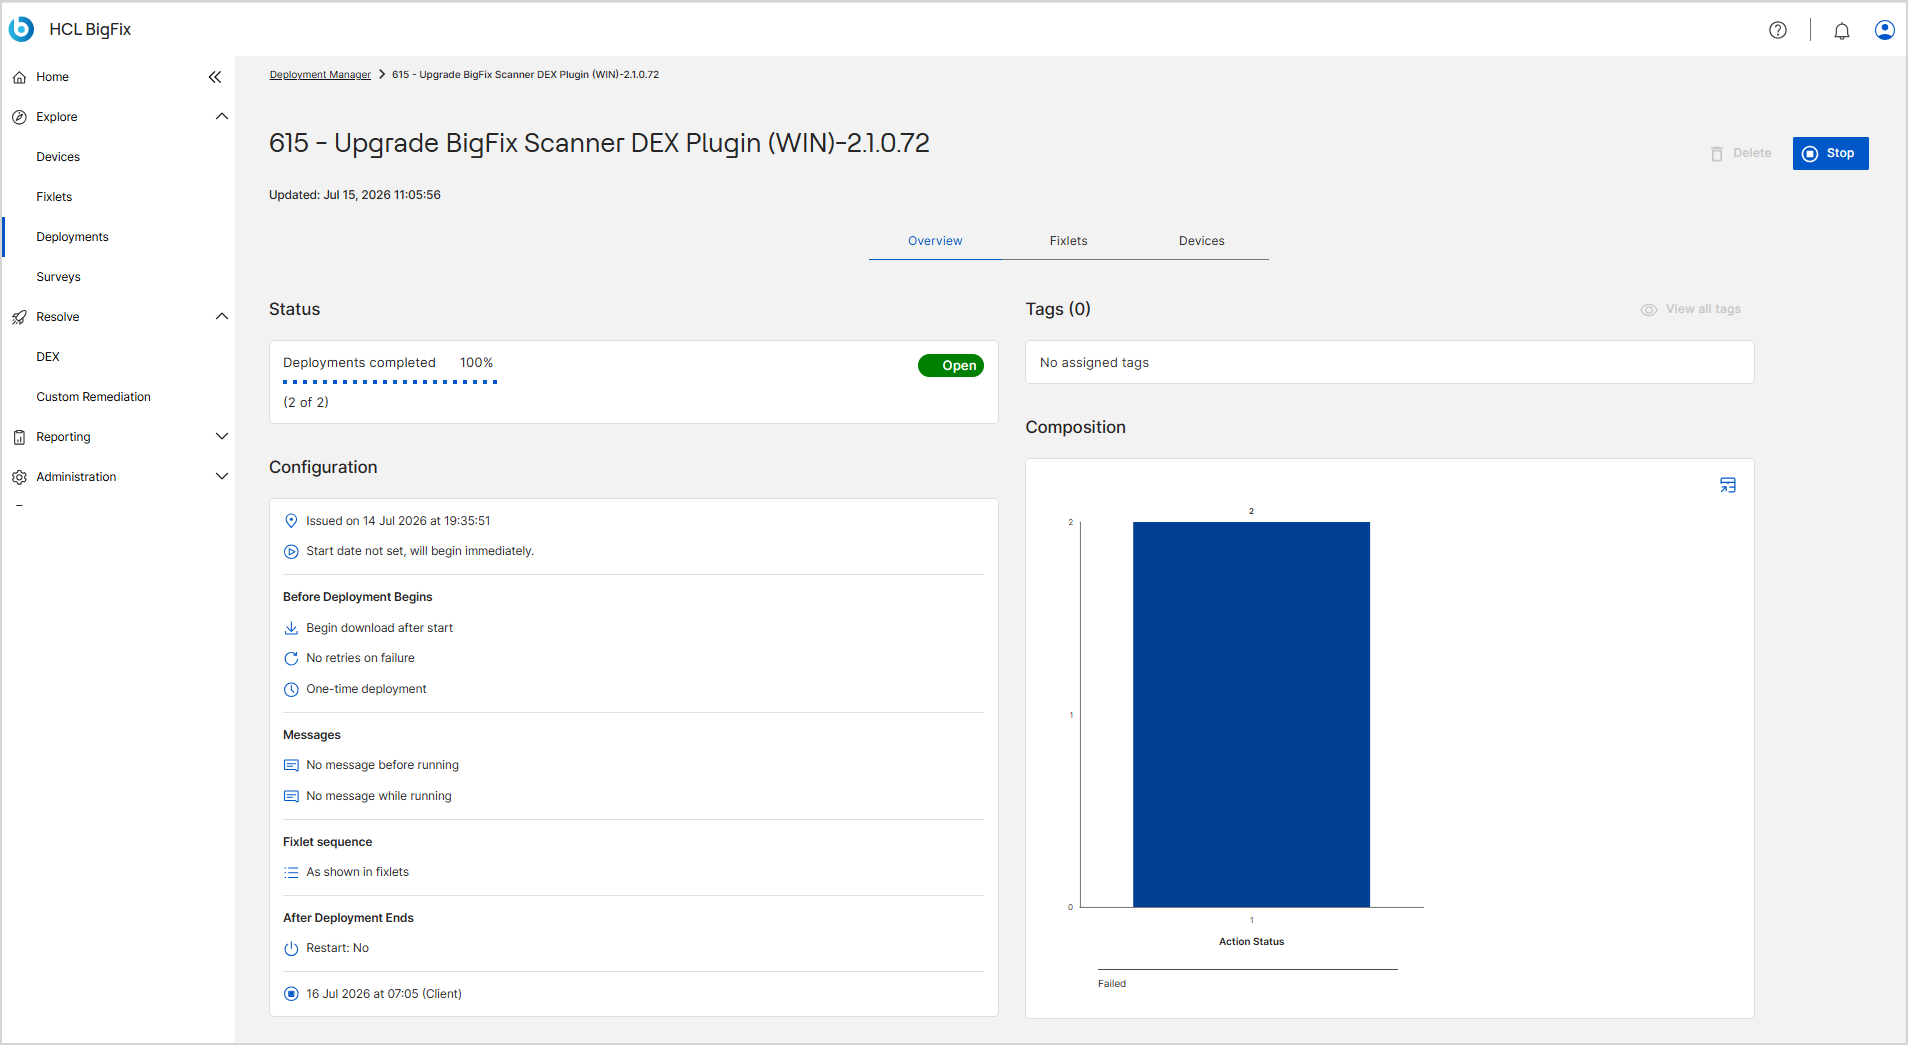
Sections displayed:
| Section | Description |
|---|---|
| Status panel | Shows Deployments completed as a percentage with a progress bar and a completed-of-total count (for example, 2 of 2), and the deployment's current state as a badge - Open, Expired, Stopped, or Scheduled. |
| Tags panel | Shows the number of tags applied to the deployment in the panel heading (for example, Tags (0)). Lists the applied tags, or shows No assigned tags if none are applied. Select View all tags to see the full tag list when there are more tags than fit in the panel. Deployment tags are read-only: you assign them on the Summary step of the remediation flow, and you can't add or remove them here. For more information, see Managing Tags. |
| Configuration panel | Lists the key configuration parameters of the deployment. See the parameter table below. |
| Composition chart | Displays a graphical breakdown of deployment status across devices as a bar chart, plotting the number of devices against Action Status (for example, Fixed, Failed, Pending). |
| Relevance card | Displays the relevance expression that the endpoint evaluates to determine
applicability. Includes a Wrap long lines toggle, a
copy to clipboard button, and a Show
More / Show Less link to expand the view.
Note: For Multiple Action Groups, you view relevance within each member action
through the Components tab. |
| Action script card | Displays the script commands that the BigFix Agent runs. Includes a
Wrap long lines toggle, a copy to
clipboard button, a Show More /
Show Less link, and the defined Success
Criteria. Note: For Multiple Action Groups, you view the action script
within each member action through the Components
tab. |
Configuration panel parameters:
| Parameter | Description |
|---|---|
| Issued on | Date and time when the deployment action was created (for example, Issued on 14 Jul 2026 at 19:35:51). |
| Start date | The scheduled start date and time for the deployment. If no start date is scheduled, shows Start date not set, will begin immediately. |
| Before Deployment Begins | Lists pre-deployment settings, such as download timing (for example, Begin download immediately or Begin download after deployment starts), failure retry behavior (for example, No retries on failure), and deployment frequency (for example, One-time deployment). |
| Messages | Indicates which messages are configured for the deployment. A separate line appears for the before-deployment message, the confirmation message, and the while-running message. For example, No message will be displayed before deployment begins, A confirmation message will be displayed before deployment begins, and A message will be displayed while deployment is running. |
| Fixlet sequence | Displays the execution order of the deployed fixlets (for example, As shown in fixlets). |
| Time constraints | Specifies when the process can run by setting a time range and restricting execution to selected days of the week. This section displays only if configured during the remediation setup. |
| After Deployment Ends | Defines post-deployment behavior set on the Behavior step, such as whether the device does nothing, restarts, or shuts down after the action completes (for example, Restart: No), and the scheduled end date and time of the deployment (for example, 16 Jul 2026 at 07:05 (Client)). |
For standalone deployments, custom remediation actions, and individual member actions in a Multiple Action Group, the Overview tab displays the execution logic and applicability conditions:
- Relevance: Displays the relevance expression that client endpoints evaluate. Enable the Wrap long lines toggle to fit extended relevance code within the panel without horizontal scrolling. Select copy to clipboard to copy the expression, or select Show More to expand the view.
- Action script: Displays the script commands that the BigFix Agent runs. Includes the Wrap long lines toggle and the copy to clipboard option.
- Success Criteria: Displayed within the Action script card,
this indicates how BigFix assesses deployment success:
- The applicability relevance evaluates to false - Used for Fixlets. The action succeeds when the relevance no longer matches after execution.
- Run to completion - Used for Tasks and custom scripts. The action succeeds when all commands run without error.
- Custom relevance expression - Evaluates against the custom success criteria that you configured at deployment time.
Fixlets tab
The Fixlets tab lists all fixlets included in the deployment along with their severity, category, source, and release details. Use this view to identify the updates or actions that were deployed.
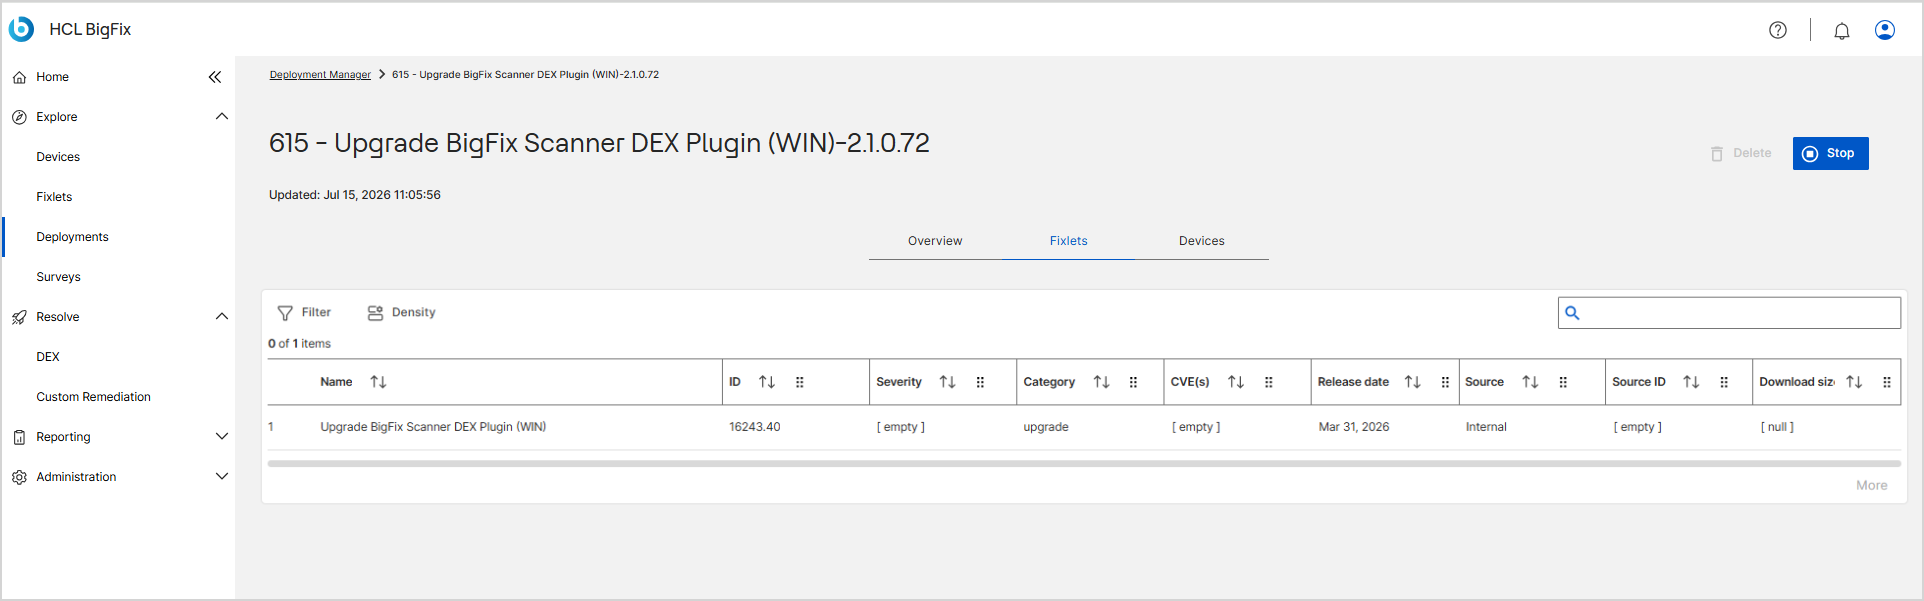
The Fixlets tab offers the following controls:
| Control | Description |
|---|---|
| Filter | Opens the filter panel to reduce the number of fixlets displayed in the data table. |
| Density | Adjusts the row height of the data table. |
| Search box | Filters the fixlet list by a keyword. The list updates automatically as you type. |
| Count line | Shows the number of fixlets selected out of the total, in the form X of Y items (for example, 0 of 1 items). |
| More | Loads additional fixlet rows when the tab has more items than currently displayed. |
Columns:
| Column | Description |
|---|---|
| Name | Fixlet title in the site. |
| ID | Numeric identifier of the fixlet in the site. |
| Severity | Vendor severity (for example, Unspecified, Low, Critical). |
| Category | Functional category (for example, Security Updates, Patch). |
| CVE(s) | CVE identifier or identifiers associated with the fixlet, if applicable. |
| Release date | Original publish date of the fixlet. |
| Source | Publisher/vendor (for example, Microsoft, HCL). |
| Source ID | Vendor reference such as a KB, CVE, or article ID. |
| Download size | Size of the payload the fixlet downloads, if applicable. |
Devices tab
The Devices tab shows all endpoints targeted by the deployment, including results such as Success or Failure. You can review each device's operating system, completion status, and DNS name to track success or troubleshoot failed systems.
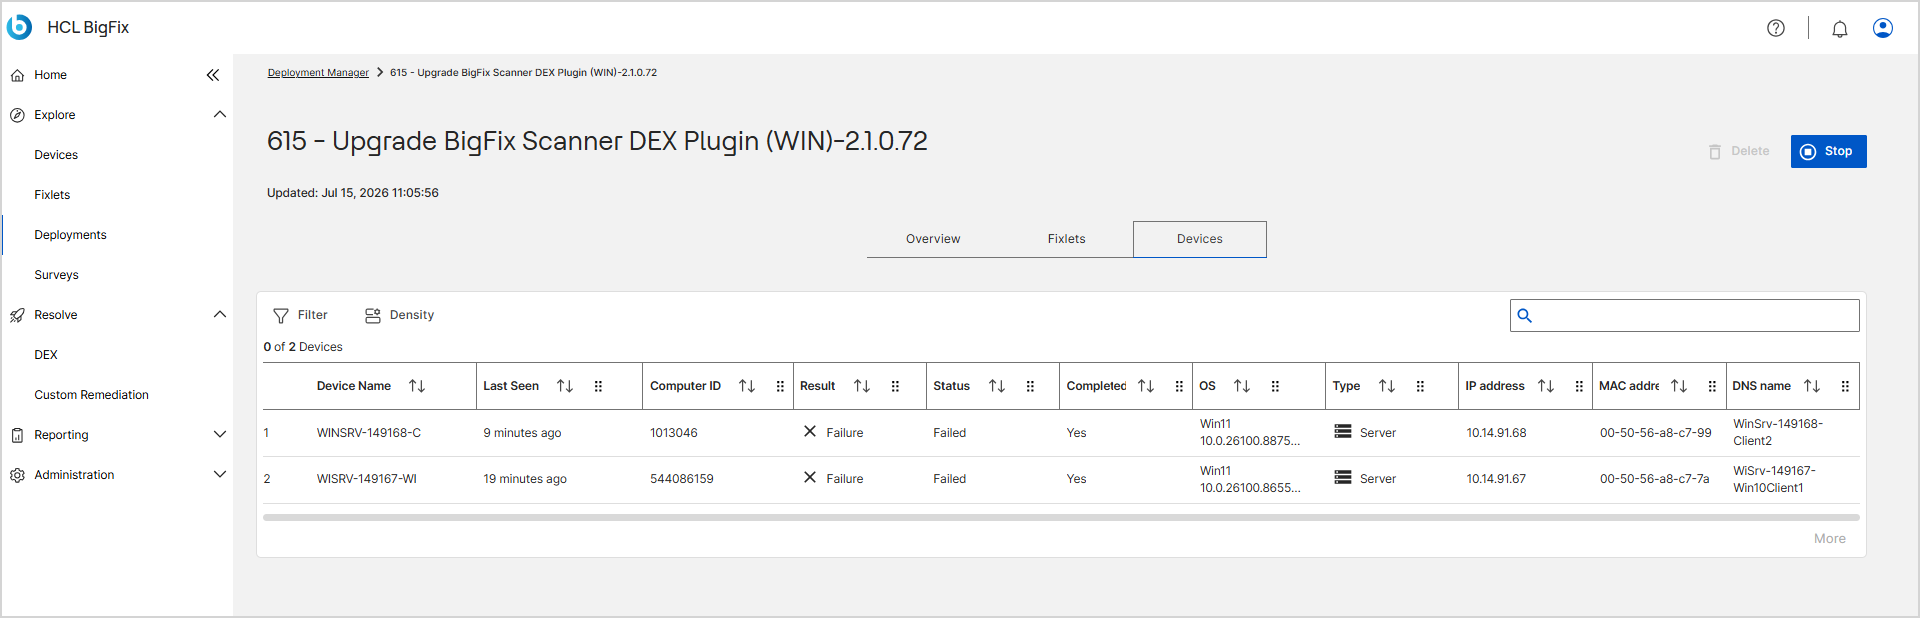
The Devices tab offers the following controls:
| Control | Description |
|---|---|
| Filter | Opens the filter panel to reduce the number of devices displayed in the data table. |
| Density | Adjusts the row height of the data table. |
| Search box | Filters the device list by a keyword. The list updates automatically as you type. |
| Count line | Shows the number of devices selected out of the total, in the form X of Y Devices (for example, 0 of 2 Devices). |
| More | Loads additional device rows when the tab has more items than currently displayed. |
Columns:
| Column | Description |
|---|---|
| Device Name | Hostname of the endpoint. |
| Last Seen | Time the device last reported to BigFix, shown relative to now (for example, 9 minutes ago). |
| Computer ID | Unique BigFix identifier. |
| Result | Action result (for example, Success, Failure). |
| Status | Fixlet state (for example, Failed, Fixed). |
| Completed | Yes if the device finished successfully. |
| OS | Operating system version. |
| Type | Device type (for example, Server, Workstation). |
| IP address | Device IP address. |
| MAC address | Device network interface MAC address. |
| DNS name | Fully qualified domain name (FQDN). |
Components tab
The Components tab appears on the Deployment Details page when you view a Multiple Action Group (MAG) deployment. BigFix creates a Multiple Action Group whenever you deploy two or more Fixlets or Tasks together in a single remediation. The parent deployment acts as a container action, and each member action carries the Multiple Action Group ID as its parent action ID.
Use the Components tab to track the status, failure rates, and details of all member actions in the group.
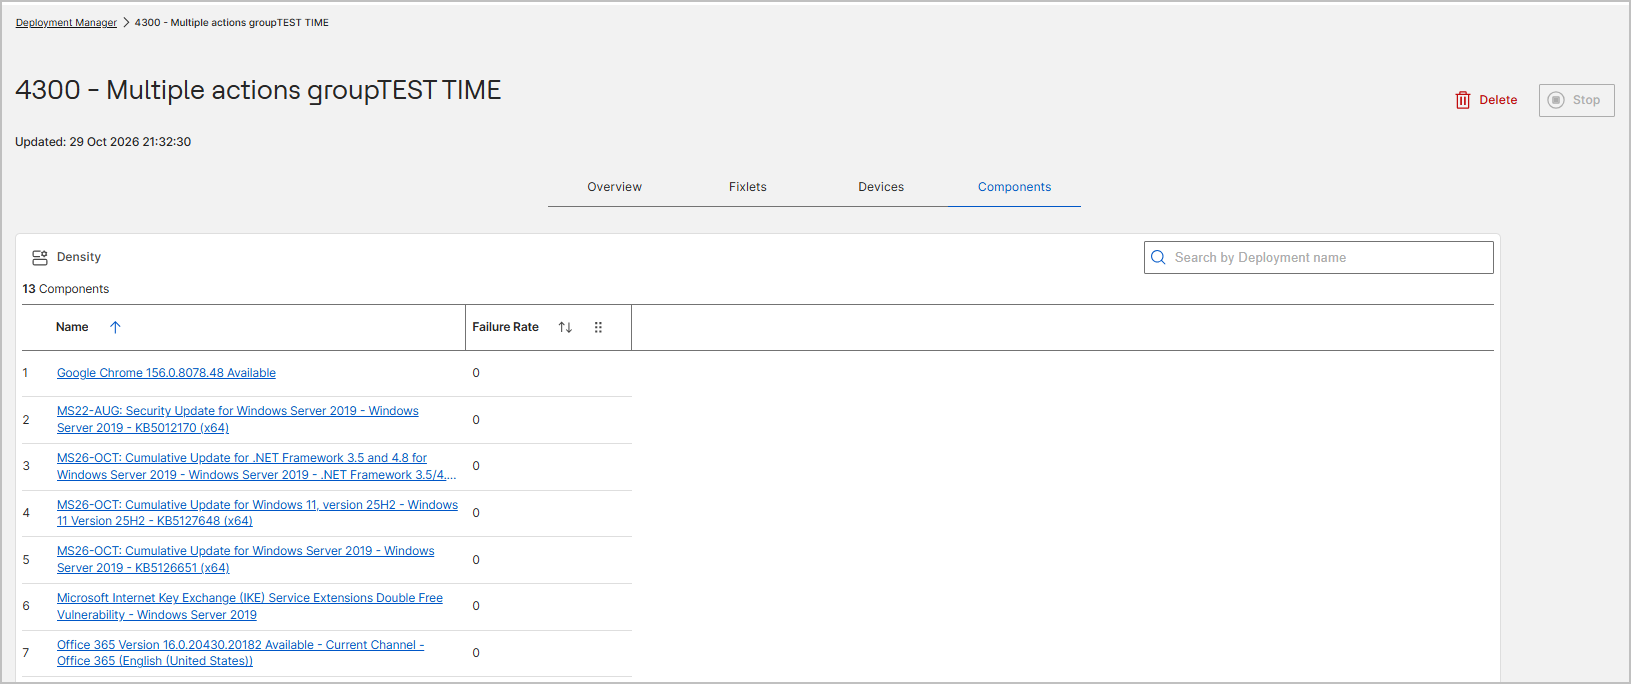
The Components tab offers the following controls:
| Control | Description |
|---|---|
| Density | Adjusts the row height of the components table. Choose Compact, Standard, or Comfortable. |
| Search by Deployment name box | Filters the member actions table by name. The list updates automatically as you type. |
| Count line | Shows the total number of member actions in the group (for example, 13 Components). |
| Column chooser | Customizes which columns the table displays. |
Columns:
| Column | Description |
|---|---|
| # | Index number of the member action. |
| Name | The name of the member action, which is the Fixlet title. Select the name link to open the Component Details page. |
| Failure Rate | The failure rate, or count, of endpoints where this member action failed. You can sort this column in ascending or descending order. |
Component Details page
Select any member action link in the Components table to open the Component Details page. This drill-down page gives you granular visibility into the execution script, applicability relevance, source Fixlet metadata, and targeted endpoints for that member action.
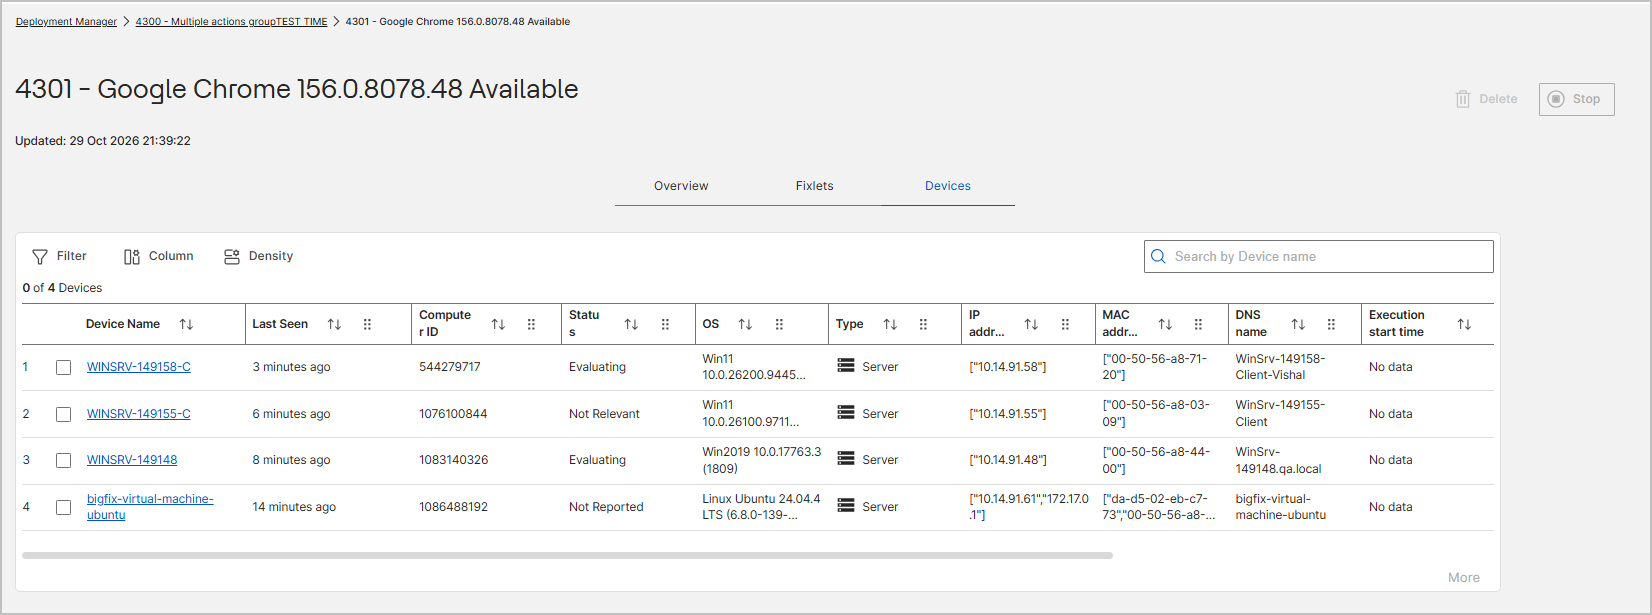
The breadcrumb at the top of the page reflects the full hierarchy: Deployment Manager > [parent MAG ID] - [parent deployment name] > [member action ID] - [member action name]. For example, Deployment Manager > 4300 - Multiple actions groupTEST TIME > 4301 - Google Chrome 156.0.8078.48 Available.
The page header displays the member action ID and title, the last updated timestamp, and the Delete and Stop buttons in the upper-right corner.
The Component Details page provides three tabs:
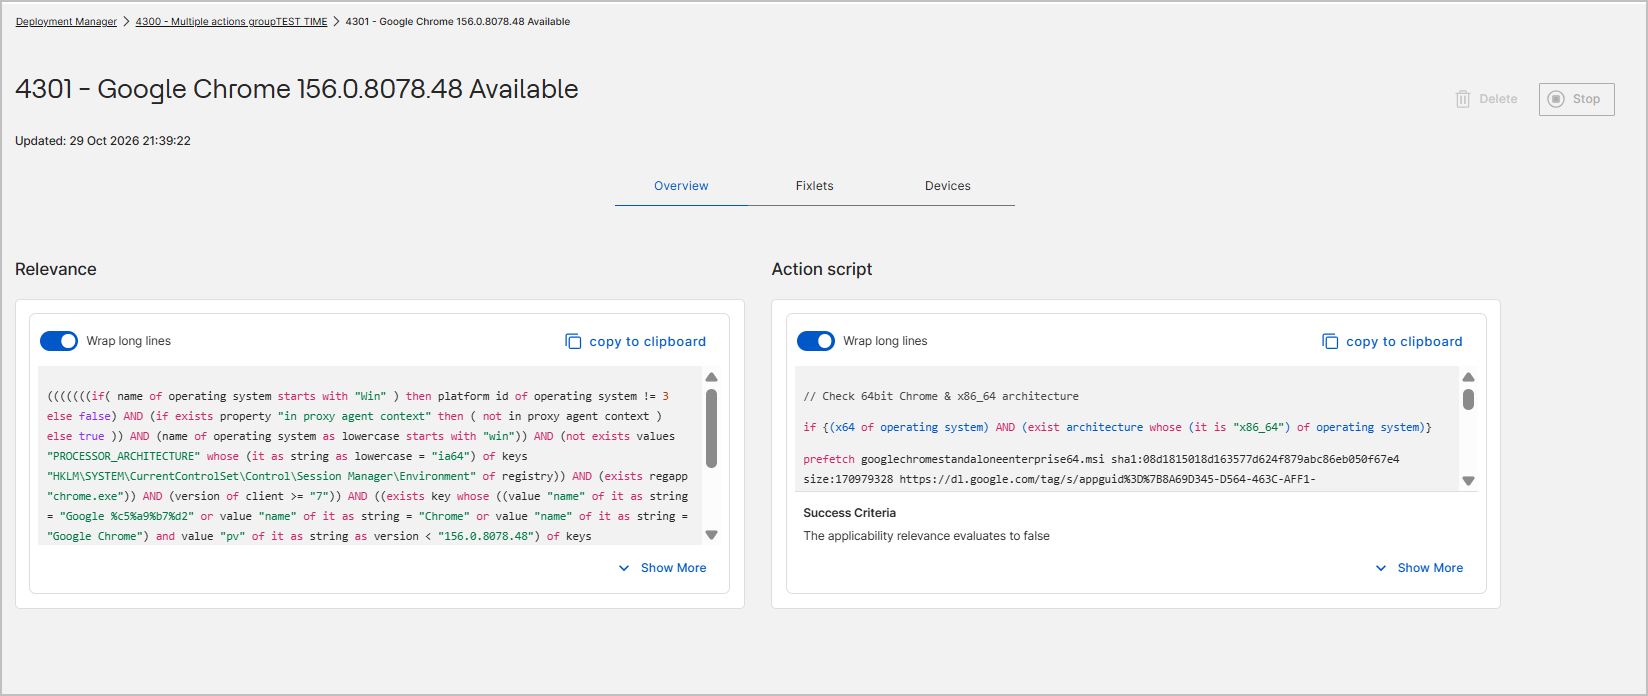
- Overview tab
-
- Relevance card: Displays the relevance expression for the member action, with a Wrap long lines toggle, a copy to clipboard button, and a Show More / Show Less expansion link.
- Action script card: Displays the action script that runs for this member action, with a Wrap long lines toggle, a copy to clipboard button, a Show More / Show Less expansion link, and the defined Success Criteria (for example, The applicability relevance evaluates to false).
- Fixlets tab
-
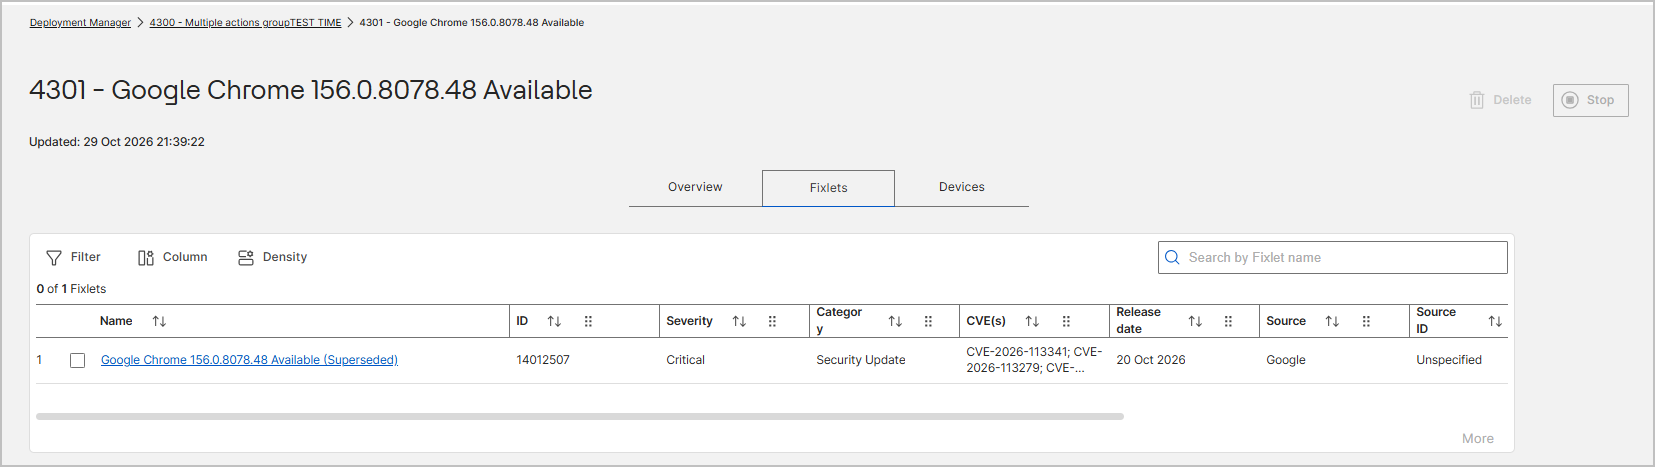
- Lists the source Fixlet associated with this member action.
- Includes the Filter, Column, and Density toolbar controls.
- Includes a Search by Fixlet name box and an item counter (for example, 0 of 1 Fixlets).
- Columns: checkbox, Name, ID, Severity, Category, CVE(s), Release date, Source, and Source ID.
- Devices tab
-
- Displays all endpoints targeted by this member action.
- Includes the Filter, Column, and Density toolbar controls.
- Includes a Search by Device name box and a selection counter (for example, 0 of 4 Devices).
- Columns: checkbox, Device Name, Last Seen, Computer ID, Status (for example, Evaluating, Not Relevant, Fixed, Failed, Not Reported), OS, Type, IP address, MAC address, DNS name, and Execution start time.